
Figures & data
Figure 1. Comparison of vitamin D and MPV levels between mild and severe ED groups.
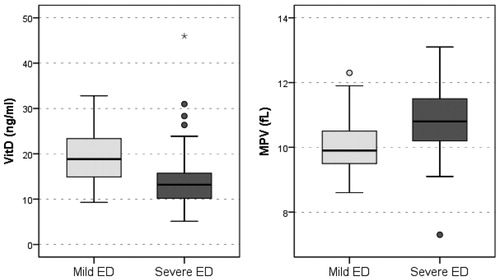
Table 1. Comparison of mild and severe ED group.
Figure 2. (a) Serum vitamin D levels were positively correlated with IIEF scores. (b) Serum MPV levels were negatively correlated with IIEF scores. (c) Serum MPV levels were negatively correlated with vitamin D levels.
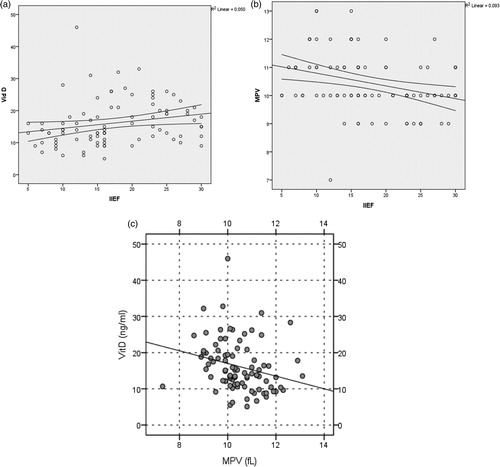
Figure 3. The activities of MPV > 10 fl and 25(OH)D of <15 ng/ml, respectively [area under the curve 0.764 (0.662–0.865)] was considered significant.
![Figure 3. The activities of MPV > 10 fl and 25(OH)D of <15 ng/ml, respectively [area under the curve 0.764 (0.662–0.865)] was considered significant.](/cms/asset/391a0302-5ba2-49ff-a39e-df85bf8f8471/itam_a_1459544_f0003_b.jpg)
Table 2. ROC curve analysis for Vitamin D and MPV levels.