Figures & data
Table 1. Selected characteristics of the US population of adult men aged ≥20 years: NHANES 1999–2004 and 2011–2012.
Table 2. Summary of dietary characteristics for NHANES cycles 1999–2004 and 2011–2012.
Figure 1. Geometric means and 95% confidence intervals of total testosterone (ng/mL) concentrations by categories of caffeine intake in 2581 participants (≥20 years old) in the NHANES cycles 1999–2004 and 2011–2012. Multivariable model was adjusted for age, race/ethnicity, education, BMI, smoking status, vigorous and moderate physical activity, total water intake, total energy intake and total alcohol intake. *Significantly different from 0 mg/day, p < .05.
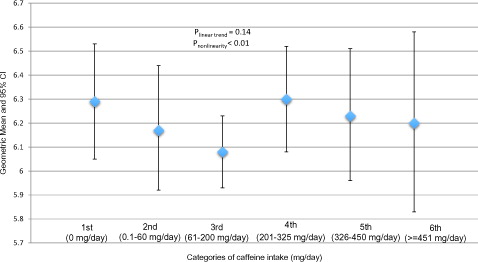
Figure 2. Association† of caffeine intake categories with testosterone deficiency (≤3 ng/mL) in the NHANES cycles 1999–2004 and 2011–2012. †Model adjusted for age, race/ethnicity, education, BMI, smoking status, vigorous and moderate physical activity, total water intake, total energy intake and total alcohol intake. *Significantly different from 0 mg/day, p < .05.
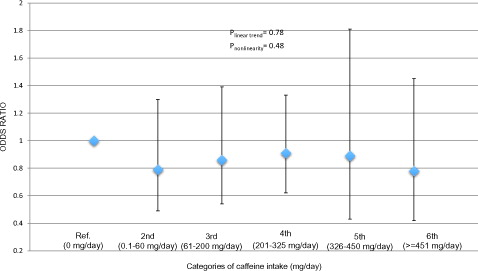
Figure 3. Geometric means and 95% confidence intervals of total testosterone (ng/mL) concentrations by categories of caffeine intake stratify by race and ethnicity: NHANES cycles 1999–2004 and 2011–2012. Multivariable model was adjusted for age, education, BMI, smoking status, vigorous and moderate physical activity, total water intake, total energy intake and total alcohol intake. MA: Mexican-Americans; NHW: non-Hispanic white; NHB: non-Hispanic black. C1 = 0 mg/day; C2 = 0.1–60 mg/day; C3 = 61–200 mg/day; C4 = 201–325 mg/day; C5 = 326–450 mg/day; C6 = ≥451 mg/day. *Significantly different from 0 mg/day, p < .05.
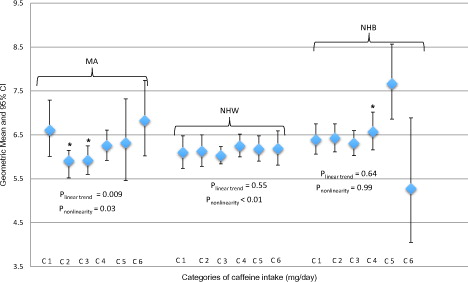
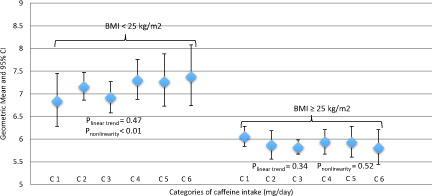
Figure 4. Stratified by body mass index (≥25 kg/m2) the association of caffeine intake categories with total testosterone (ng/mL) concentrations in 2581 participants (≥20 years old) in the NHANES cycles 1999–2004 and 2011–2012. Multivariable model was adjusted for age, education, smoking status, vigorous and moderate physical activity, total water intake, total energy intake and total alcohol intake. C1 = 0 mg/day; C2 = 0.1–60 mg/day; C3 = 61–200 mg/day; C4 = 201–325 mg/day; C5 = 326–450 mg/day; C6 = ≥451 mg/day. Body mass index ≥25 kg/m2 is defined as overweigh/obesity. *Significantly different from 0 mg/day, p < .05.