
Figures & data
Figure 1. Monthly air pollution data. The panel shows the monthly average concentrations and trends of PM 10 in the ambient air of Kermanshah, Iran, during 2011–2015.
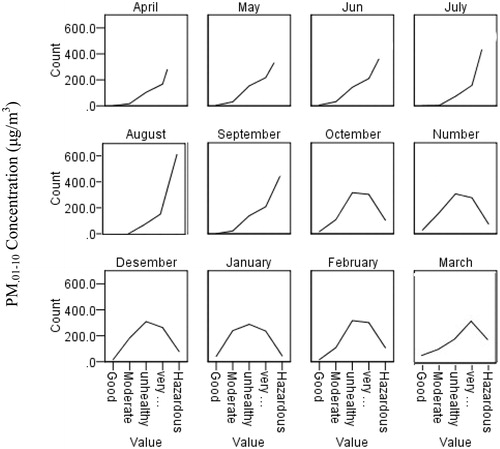
Table 1. Demographic characteristics of the study populations.
Table 2. Descriptive statistics for semen parameters before and after laboratory processing of 850 infertile men who presented at Motazedi Infertility Center, 2011–2016.
Table 3. Summary of semen parameters according to different age groups.
Table 4. Correlation between semen parameters and PM0.01–10 levels before and after lab processing.
Table 5. Spearman’s Rho, correlation coefficients (R) with 99% confidence intervals between continuous variables in this study.