
Figures & data
Table 1. Demographic data and differences between patients who underwent psychotherapy and no psychotherapy.
Figure 1. Patients satisfaction in IIEF-5, with life in general, sexual life, partner and intimacy, with better results in patients who underwent psychotherapy.
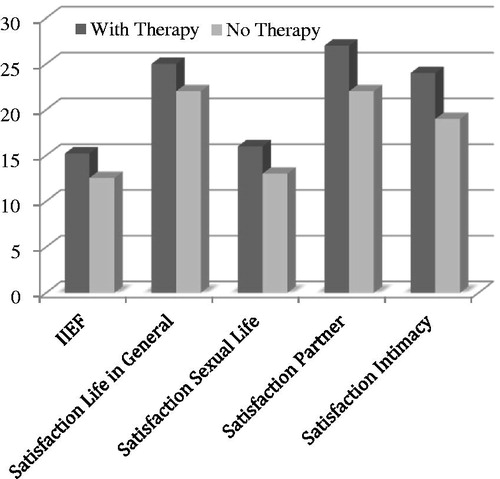
Figure 2. SF-36 better results in patients who underwent psychotherapy, excepting two domains: bodily pain and role emotional.
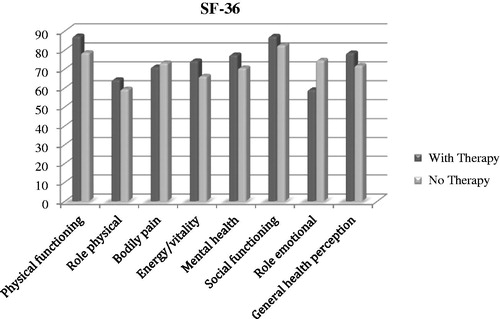
Table 2. Statistical differences between groups.
Table 3. Multivariate analysis correlating the questionnaires with the different domains from patients who underwent group psychotherapy.
Table 4. Multivariate analysis correlating the questionnaires with the different domains from patients who did not underwent group psychotherapy.