
Figures & data
Table 1. Clinical characteristics of patients.
Table 2. Comparison of patients’age, bmi, total psa, prostate volume, PSAD between Cancer and non-cancer groups.
Table 3. Comparison of patients’age, BMI, total PSA, F/T PSA, prostate volume and PSAD between cancer and non-cancer groups with PSA 2.5–10 ng/ml and PSA 10.1–30 ng/ml.
Figure 1. The ROC analysis for F/T PSA, prostate volume and PSA density alone in predicting prostate cancer with a PSA of 2.5–10.0 ng/ml.
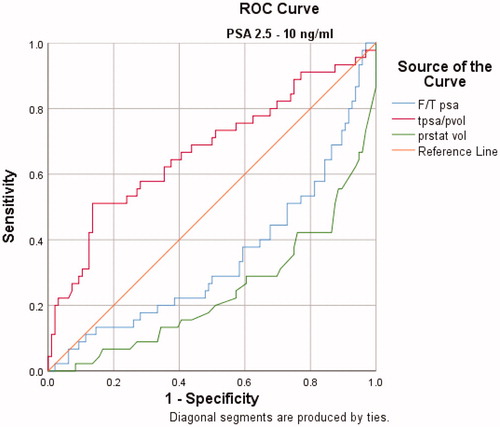
Figure 2. The ROC analysis for F/T PSA, prostate volume and PSA density alone in predicting prostate cancer with a PSA of 10.1–30.0 ng/ml
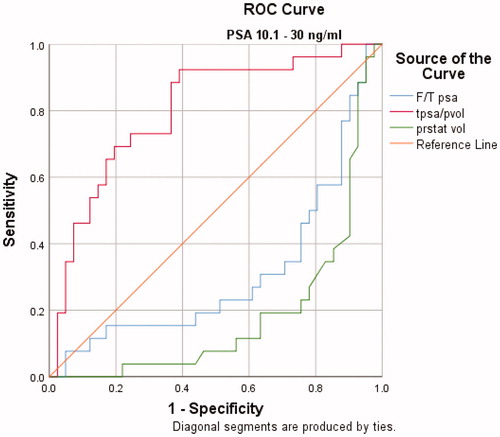
Table 4. The AUCs for F/T PSA, prostate volume and PSA density in predicting risk of prostate cancer stratified by PSA.
Table 5. Comparison of patients’age, BMI, total PSA, prostate volume, PSAD, biopsy result and Gleason score according to the cutoff value of prostate volume with PSA 2.5–10 ng/ml and PSA 10.1–30 ng/ml.
Table 6. Multivariate analyses for patients with PSA of PSA 2.5–10 ng/ml and PSA 10.1–30 ng/ml.