Figures & data
Table 1. Baseline characteristics of study participants.
Figure 1. Genitourinary signs and symptoms of men from Blue November Campaign 2015 by age group. (A) Mean of IPSS by age group. (B) Mean of PSA by age group. (C) Mean of IIEF-5 by age group.
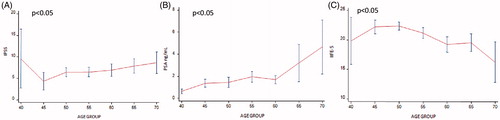
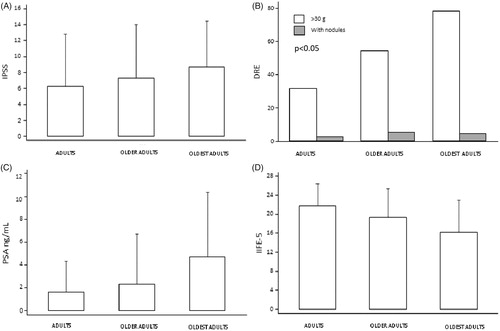
Figure 2. Changes of genitourinary signs and symptoms of men from Blue November Campaign 2015 by aging group: adults (43 to 59 years), older adults (60 to 69 years) and oldest adults (70 to 80 years or more). (A) Mean of IPSS by aging group. (B) Number of DER > 30 g by aging group. (C) Mean of total PSA by aging group. (D) Mean of IIEF-5 by aging group.