
Figures & data
Table 1. Primary antibodies used for immunohistochemical staining.
Table 2. Relative gene expression to ACTB (β-actin), both in healthy tunica albuginea (control) and affected plaque.
Figure 1. Relative gene expression to ACTB (β-actin), and representative pictures with quantification of immunohistochemical staining, both in tunica albuginea (control) and plaque. (A) COL1A1 gene and corresponding protein collagen type I. (B) COL3A1 gene and corresponding protein collagen type III. (C) ACTA2 gene and corresponding protein α-SMA. *p < .05 as determined by the Wilcoxon paired rank test. HPF: high-power field.

Figure 2. Representative pictures and quantification of immunohistochemical staining, both in tunica albuginea (control) and plaque. The following proteins were tested: Wnt2; Wnt4; Wnt5a; Wnt7b; β-catenin; WISP1; YAP1. *p < .05, **p < .01 as determined by the Wilcoxon paired rank test. HPF: high-power field.
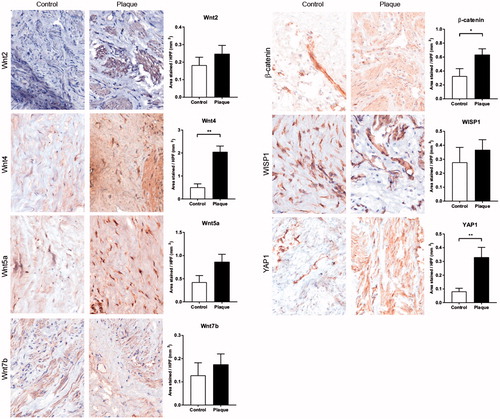
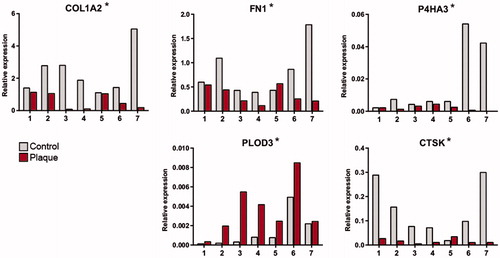
Figure 3. Relative gene expression to ACTB (β-actin), both in tunica albuginea (control) and affected plaque from seven patients with PD. The following genes are shown: COL1A2; FN1; PLOD3; P4HA3; CTSK) *p < .05 as determined by the Wilcoxon paired rank test.
Data availability statement
The data that support the findings of this study are available from the corresponding author, EJtD, upon reasonable request.