
Figures & data
Table 1. Data of prostatic epithelium height and blood pressure in the beginning and in the end of the experiment, confirming the experimental model.
Figure 1. Penile histological sections of control and BPH rats with dutasteride or dutasteride and sildenafil treatment. Images A, B, C, and D were stained by Picrosirius red, captured under 20× magnification, and used for assessing the areas of the penis, corpus cavernosum (including its tunica albuginea), and the corpus cavernosum without the tunica albuginea. Images E, F, G, and H were stained by Masson’s trichrome, captured under 400× magnification, and used for assessing the connective tissue and sinusoidal space surface densities. Images I, J, K, and L were immunolabeled with anti-alpha-actin antibodies, captured at 400× magnification and used for assessing the smooth muscle surface density. Ctrl: control group, composed of Wistar Kyoto rats (images A, E, and I); BPH: group of benign prostatic hyperplasia models (images B, F, and J); BPH + D: group of BPH models receiving dutasteride (images C, G, and K); BPH + DS: group of BPH models receiving dutasteride and sildenafil (images D, H, and L).
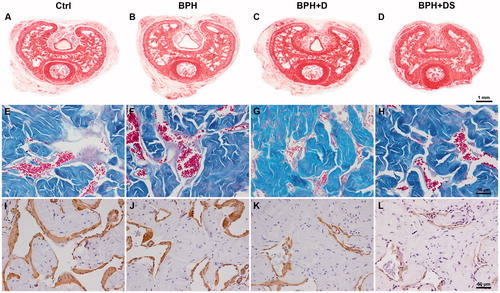
Table 2. Data of penile morphometric analyses.