
Figures & data
Table 1. Demographic, clinical and polysomnographic data of patients.
Table 2. Comparison of demographic, polysomnographic and co-morbidities of the exitus and surviving groups.
Table 3. Comparision of the exitus and surviving groups according to gender, clinical, disease severity and treatment options.
Figure 1. Survival analysis of patients with AHI/hr greater than 50/h.
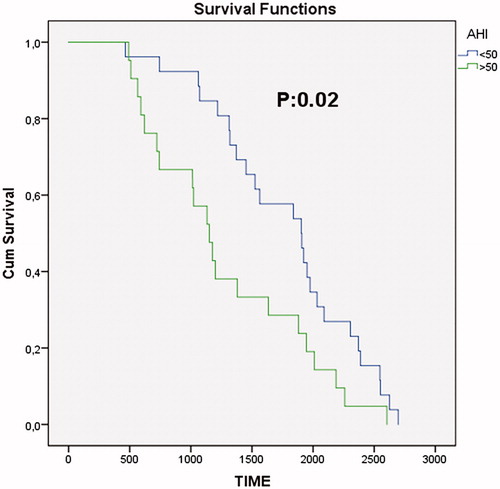
Table 4. According to regression analysis, the cases with the most significant relationship with mortality.