Figures & data
Figure 1. NR2F2-AS1 and CDK4 mRNA were upregulated and positively correlated in PC. Expression levels of NR2F2-AS1 (A) and CDK4 mRNA (B) in two types of tissues (non-tumor and PC) were measured and compared by qPCR and paired t test, respectively. Pearson’s correlation coefficient was used to analyze the correlations between NR2F2-AS1 and CDK4 mRNA in both PC (C) and non-tumor (D) tissues. Mean values of three biological replicates were presented, *p < 0.05.
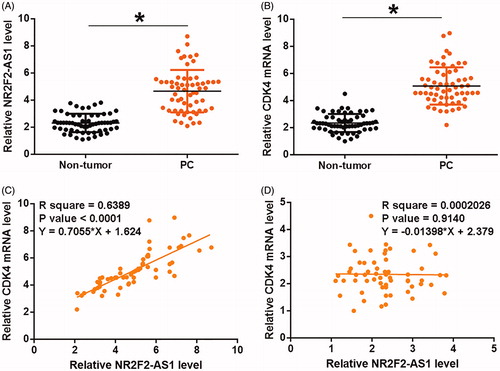
Figure 2. NR2F2-AS1 negatively regulated CDK4 in 22Rv1 cells. 22Rv1 cells were transfected with NR2F2-AS1 and CDK4 expression vectors as well as NR2F2-AS1 siRNA. Transfections were confirmed by qPCR at 24h post-transfection (A). Effects of NR2F2-AS1 overexpression and siRNA silencing on expression of CDK4 mRNA and protein were analyzed by qPCR and western blot, respectively (B). The effects of CDK4 overexpression on NR2F2-AS1 were analyzed by qPCR (C). Mean values of three biological replicates were presented, *p < 0.05.
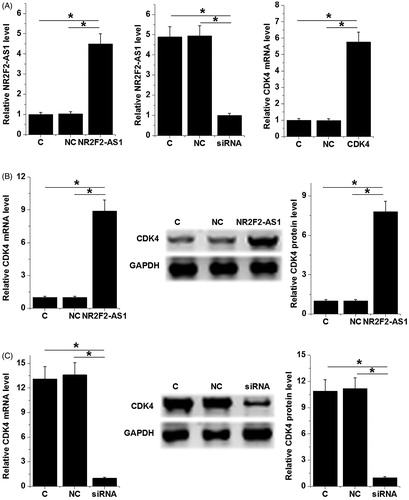
Figure 3. High levels of NR2F2-AS1 and CDK4 predicted poor survival. Patients were divided into high (n = 30) and low (n = 30) NR2F2-AS1 (A)/CDK4 (B) level groups with the median expression level of NR2F2-AS1/CDK4 in PC tissues as cutoff value. Survival curves were plotted and compared by K-M plotter and log-rank test, respectively.
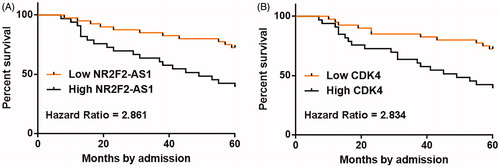
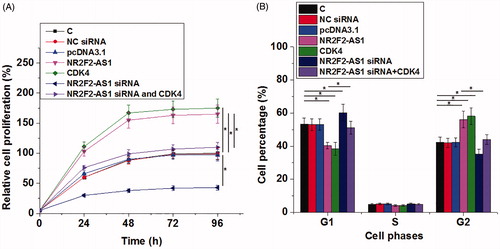
Figure 4. NR2F2-AS1 promote cell proliferation and cell cycle progression through CDK4. The effects of transfection on cell proliferation and cell cycle progression were analyzed by CCK- 8 (A) and cell cycle (B) assays, respectively. Mean values of three biological replicates were presented, *p < 0.05.