
Figures & data
Figure 1. Flow diagram of enrollment.
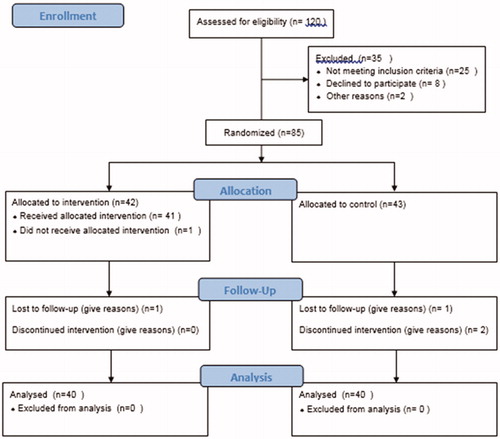
Table 1. Comparison of demographic characteristics of the participants.
Table 2. Comparison of mean score of knowledge between intervention and control groups before and after the intervention.
Table 3. Comparison of mean score of attitudes between intervention and control groups before and after intervention.