Figures & data
Figure 1. The contractile responses of the human urinary bladder smooth muscle strips to oxytocin without (a, b) or with atosiban (d) and carbachol (c) in isolated in-vitro organ bath. A- Cumulative oxytocin concentration-response curves for all human urinary bladder strips. B- Cumulative concentration response of patient ID: 2 (the only responsive tissue) in 10−6 M concentration. C- Carbachol concentration-response to 10−5 M (functionality test). D- Cumulative concentration response of the human urinary bladder smooth muscle strips to oxytocin pretreated with 10-5 M atosiban (Y axis is 10%).
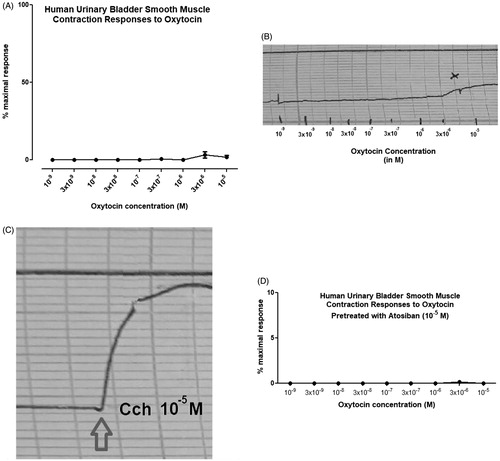
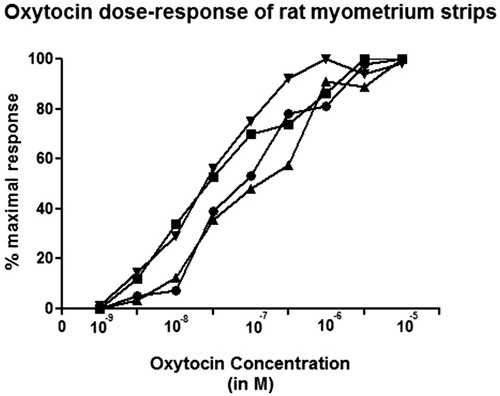
Figure 2. The cumulative contractile effects of oxytocin in rat uterine smooth muscle strips in isolated in-vitro organ bath. Each line represents the individual responses of four different uterine smooth muscle strip in four experiments.