Figures & data
Table 1. Study population characteristics. Values reported as mean ± SD or as count (percentage).
Figure 1. Pooled results of 1 year of TTh on glycated hemoglobin A1c (HbA1c), n = 55.
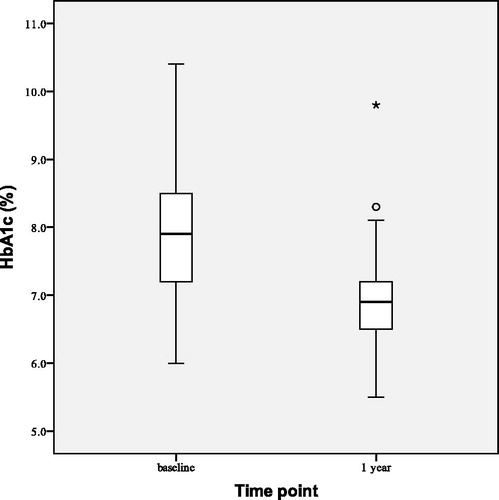
Figure 2. Pooled results of 1 year of TTh on HOMA-IR, n = 55.
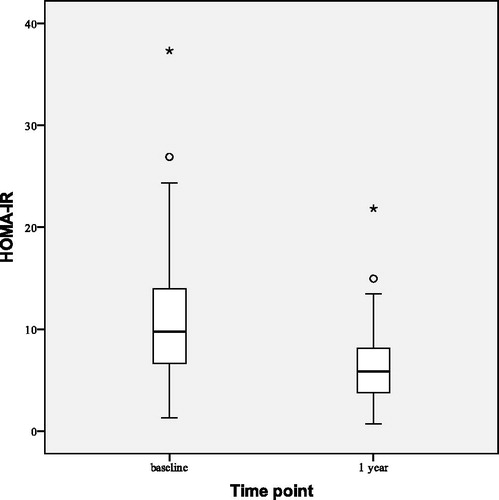
Figure 3. Pooled results of 1 year of TTh on non-HDL cholesterol, n = 55.
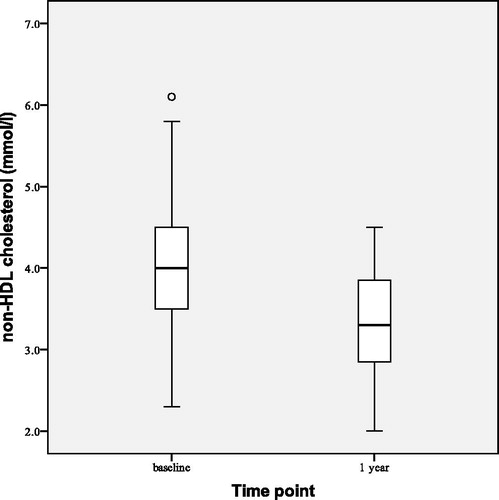
Table 2. Effects of testosterone treatment on parameters of metabolic syndrome after 12 months of testosterone replacement therapy—pooled results for both groups P and T (n = 55).
Figure 4. Pooled results of 1 year of TTh on FMD of brachial artery, n = 55.
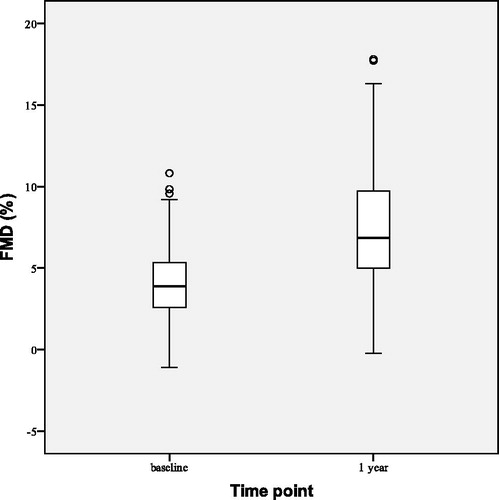
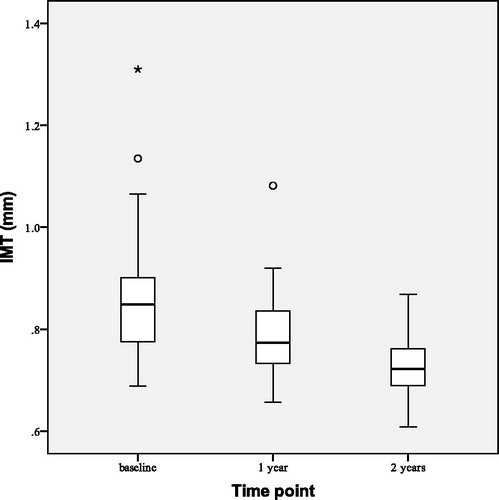
Figure 5. Pooled results of 1 year of TTh on IMT of carotid arteries, n = 55.
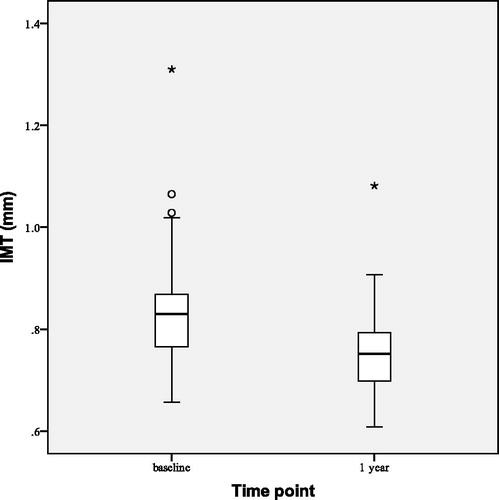
Table 3. Effects of testosterone treatment on parameters of metabolic syndrome after 24 months of therapy—results for group T (n = 28).
Figure 6. Group T results of 2 years of TTh on glycated hemoglobin A1c (HbA1c), n = 28.
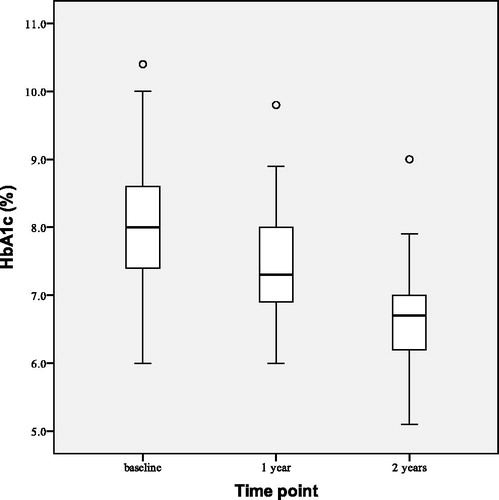
Figure 7. Group T results of 2 years of TTh on HOMA-IR, n = 28.
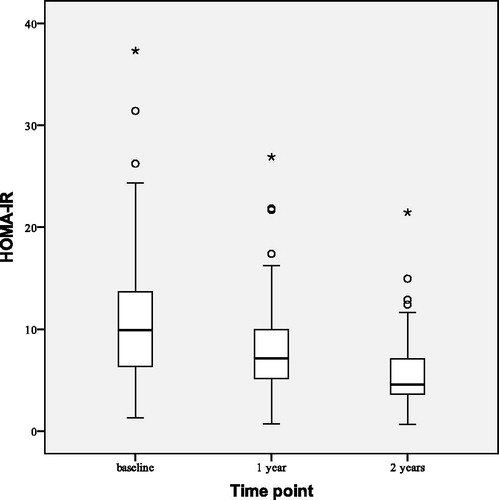
Figure 8. Group T results of 2 years of TTh on non-HDL cholesterol, n = 28.
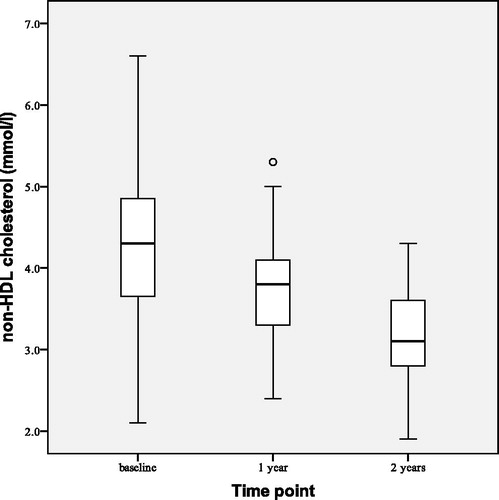
Figure 9. Group T results of 2 years of TTh on FMD of brachial artery, n = 28.
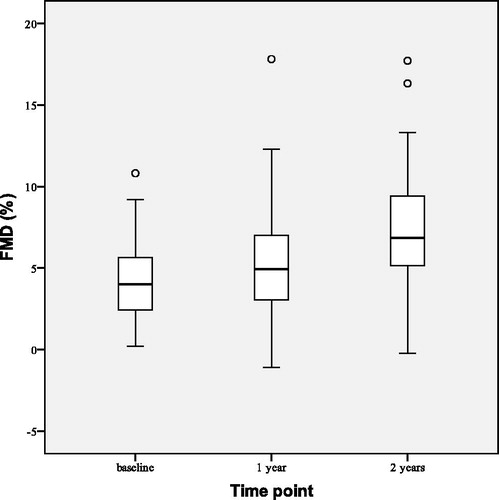
Figure 10. Group T results of 2 years of TTh on IMT of carotid arteries, n = 28.