
Figures & data
Figure 1. OSAS severity – HCO3 ANOVA.
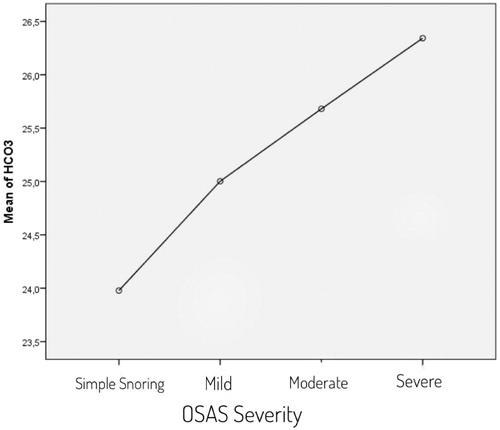
Figure 2. The predictive value of serum HCO3 in identifying OSAS patients (ROC curve) (AUC: 0.925).
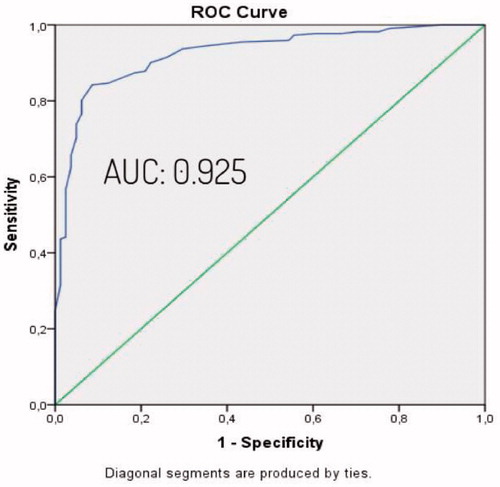
Figure 3. The value of serum HCO3 levels in identifying severe OSAS patients (ROC curve), (AUC: 0.857).
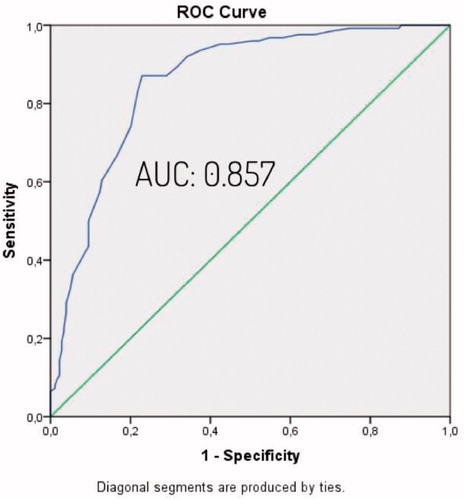
Table 1. Descriptive characteristics of patients.
Table 2. Comparison of demographic features and arterial blood gas values between patients with or without OSAS.
Table 3. Predictors of OSAS (binary logistic regression analysis).
Table 4. OSAS severity–HCO3 ANOVA.
Table 5. The predictive value of Berlin Sleep Questionnaire in identification of OSAS or severe OSAS patients and combination with HCO3 cut off values.