Figures & data
Table 1. Demographic and clinical characteristics of the study sample.
Table 2. Descriptive statistics and between-group t-test outcomes.
Figure 1. Bar graphs demonstrating the serum IL-6 levels of the patient and control groups.
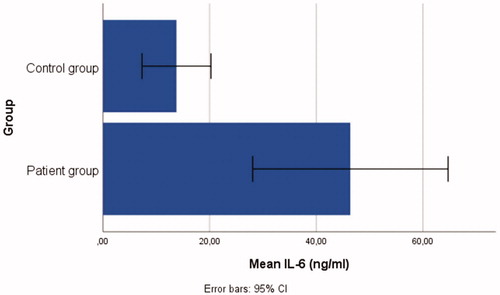
Figure 2. Bar graphs demonstrating the serum IL-37 levels of the patient and control groups.
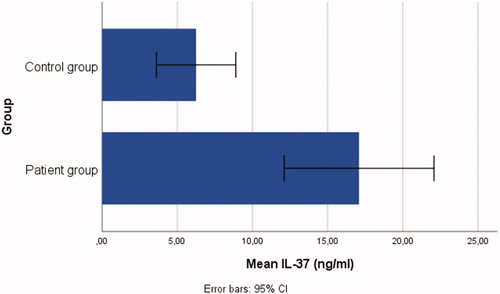
Figure 3. Bar graphs demonstrating the serum TNF-α levels of the patient and control groups.
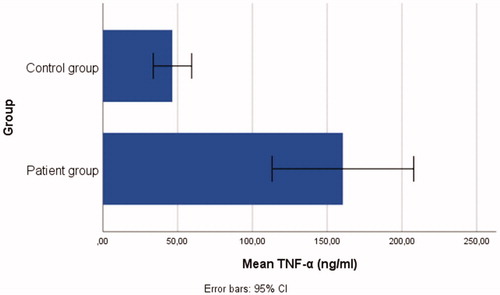
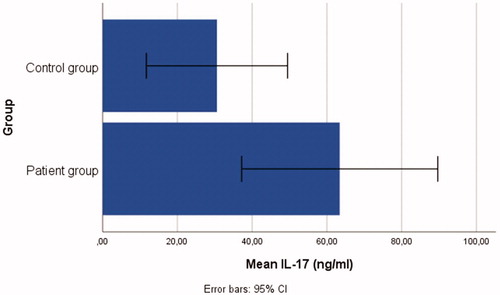
Figure 4. Bar graphs demonstrating the serum IL-17 levels of the patient and control groups.