
Figures & data
Figure 1. ROI’s placed on the right and left side of the peripheral zone of the prostate in hyperintense areas of axial T2w sequence. The NVB indicates the perfusion coming from posterolateral direction (A). Ratio of enhancement measured over time via signal intensity curves of contrast agent (B).
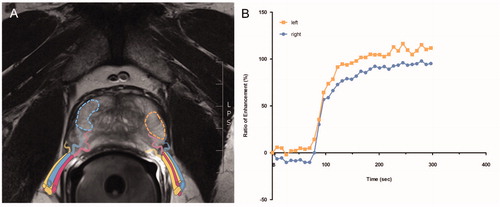
Table 1a. Patient characteristics stratified by ED groups according to IIEF-5 score preoperative: “no” (IIEF-5 score = 25-22), “mild” (21-17), “moderate” (16-12) and “severe” (11-5).
Table 1b. Patient characteristics stratified by ED groups according to IIEF-5 score at 12 months postoperative: “no to mild” (IIEF-5 score = 25-17 points) vs. “moderate to severe” (16-5 points).
Figure 2. Difference in Ratio120 between ED groups according to preoperative IIEF-5 score, displayed as boxplots: Divided into four ED groups “no” (IIEF-5 score = 25-22 points) vs. “mild” (21-17) vs. “moderate” (16-12) vs. “severe” (11-5) (A) and into two ED groups “no to mild” (25-17) vs. “moderate to severe” (16-5) (B). *p < .05, ***p < .001. Correlation plot displaying the association between preoperative IIEF-5 score and the Ratio120 (r = 0.25, p = .012) (C). Diagnostic model as ROC curves with Ratio120 including age and comorbidities (AUC 0.833, threshold 0.14, specificity 70.5%, sensitivity 89.5%, dashed line). Compared to ROC curve for diagnostic model with age and comorbidities (AUC 0.800, threshold 0.37, specificity 94.9%, sensitivity 57.9%, dot-dashed line) and ROC curve for age alone (AUC 0.718, threshold 0.37, specificity 94.9%, sensitivity 42.1%, dotted line). Cohort of .
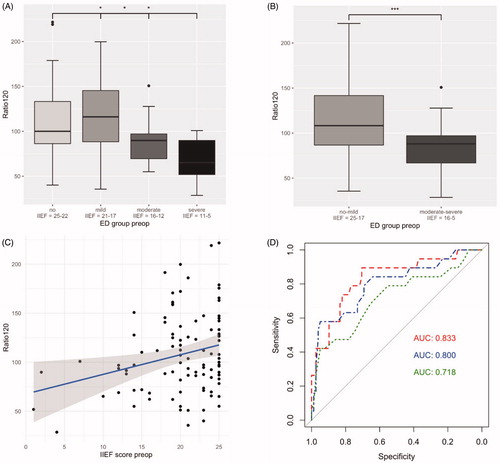
Figure 3. Difference in Ratio120 between the postoperative ED group “no to mild” (IIEF-5 score = 25-17) vs. “moderate to severe” (16-5) displayed as boxplot (128.84% vs. 101.95%, p = .029) (A). Correlation plot displaying the association between postoperative IIEF-5 score and the Ratio120 (r = 0.31, p = .044) (B). Cohort of . Boxplots of difference in Ratio120 between clinical outcome groups of “small” (IIEF-5 score <4 points), “intermediate” (4-15 points) and “large” (>16 points) CS (Citation2(2,40) = 3.21; p = .051). Illustrated difference in Ratio120 between best (“small”) and worst (“large”) CS group (129.6% vs. 95.7%, p < .0071). Usage of PDE-5-I was present in 10/21 patients in the “small”, 5/8 patients in the “intermediate” and 1/14 patient in the “large” CS group (47.6% vs. 62.5% vs. 7.1%, respectively) (C). ROC curve for demonstration of the discriminative ability of a diagnostic model with Ratio120 together with age, preoperative IIEF-5 score and NS (AUC 0.887, threshold: 0.45, specificity: 81.8%, sensitivity: 90.5%, dashed line). ROC curve for model with age, preoperative IIEF-5 score and NS (AUC 0.833, threshold: 0.34, specificity 63.6%, sensitivity 100.0%, dot-dashed line) and ROC curve for model with age and preoperative IIEF-5 score (AUC 0.694, threshold 0.52, specificity 81.8%, sensitivity 71.4%, dotted line) (D).
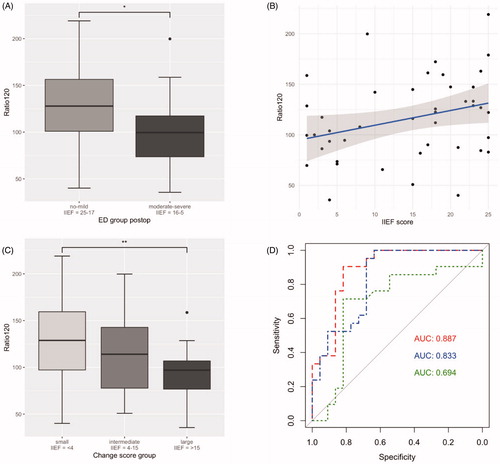
Table 2. Univariable regression analysis for the Ratio120 (A) and multivariable regression analysis adjusted for age, preoperative IIEF-5 score and bilateral NS (B) to predict the odds of belonging to the “no to mild” ED group.