
Figures & data
Figure 1. Flow diagram of the study population.
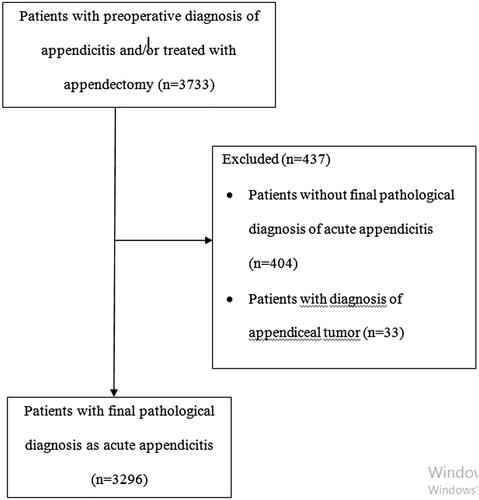
Figure 2. Line graph showing mean age (year) with 95% confidence interval of the patients throughout the study years between 2007 and 2016, by year. The numbers 1 to 10 indicates the years 2007 to 2016, respectively.
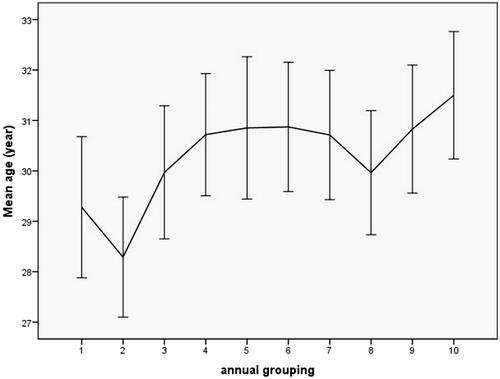
Figure 3. Correlation between mean age of the patients (line y:mean_age) and the study years (line x: no_of_years). The numbers 1 to 10 in line × indicates the years 2007 to 2016, respectively.
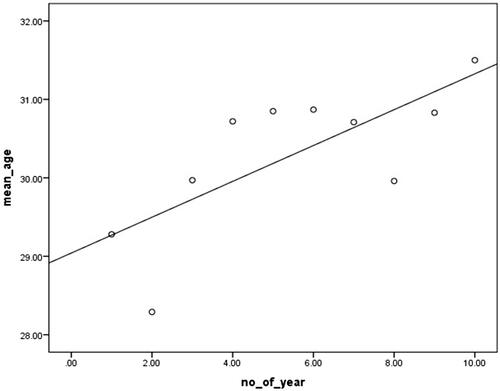
Figure 4. Correlation between the percent value of the older patients (≥60 years) (line y:percent_older_patients) and the study years (line x: no_of_years). The numbers 1 to 10 in line × indicates the years 2007 to 2016, respectively.
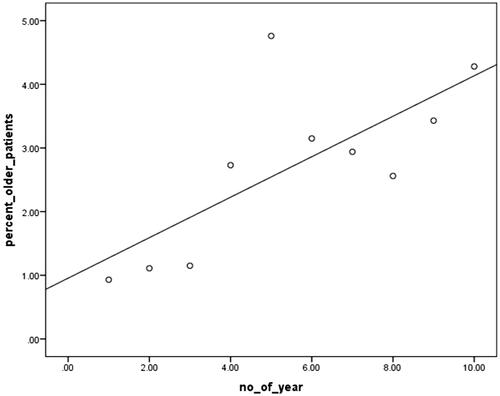
Table 1. Demographic variables of the patients with final pathological diagnosis of acute appendicitis (n = 3296) based on an annual base.