
Figures & data
Figure 1. Transthoracic echocardiography parasternal long-axis view demonstrating the epicardial fat tissue as the hypoechoic space on the right ventricular free wall at end-diastole.
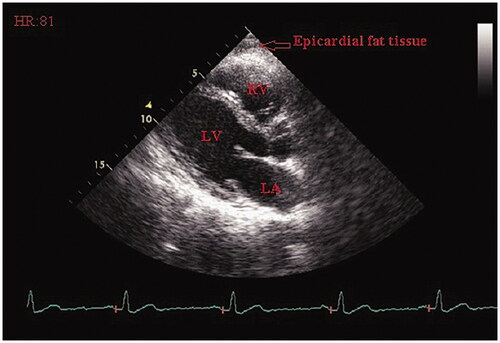
Table 1. The baseline characteristics and laboratory findings of study patients.
Figure 2. The Spearman correlation analysis showed that a significant correlation was observed between EFT thickness and IIEF-5 score.
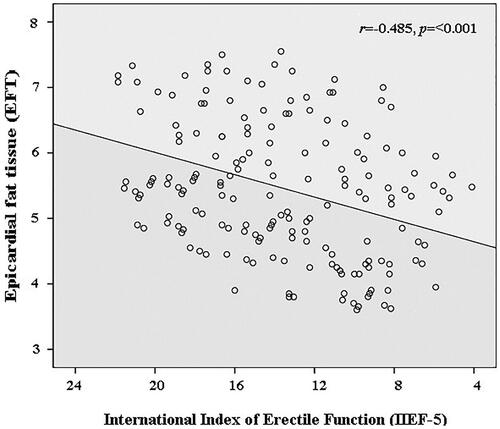
Table 2. The conventional echocardiographic findings of study patients.
Table 3. The 2D speckle tracking echocardiographic findings of study patients.
Table 4. Independent predictors of LV-GLS in multiple linear regression analysis.
Table 5. Independent predictors of LV-GCS in multiple linear regression analysis.