Figures & data
Table 1. Disorders and conditions most frequently associated with TD.
Table 2. Medications that may be the reason for low testosterone level/decreased testosterone bioactivity.
Figure 1. Threshold continuum to hypogonadism.
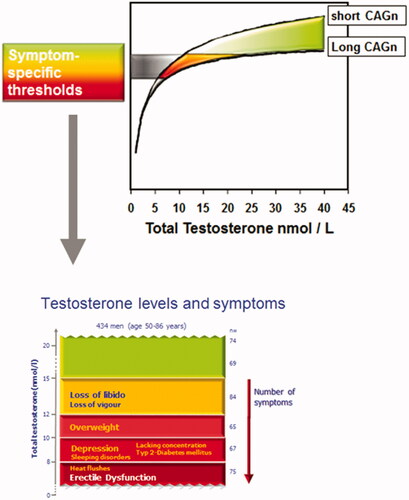
Figure 2. Saturation curve, demonstrating the relationship between testosterone and prostate cancer.
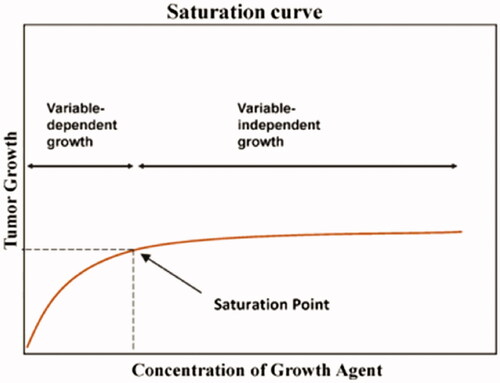
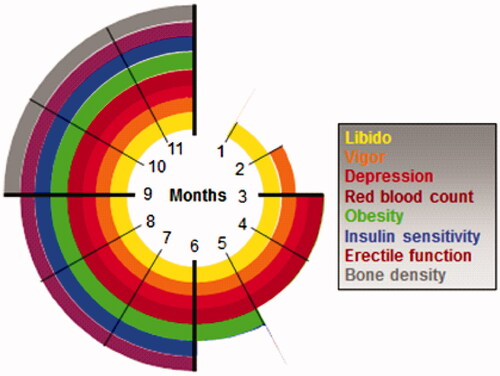
Figure 3. Time-dependent onset of effects of testosterone substitution therapy.