
Figures & data
Figure 1. Participant selection of community-dwelling men. The number of included and excluded participants is shown. ED: erectile dysfunction.
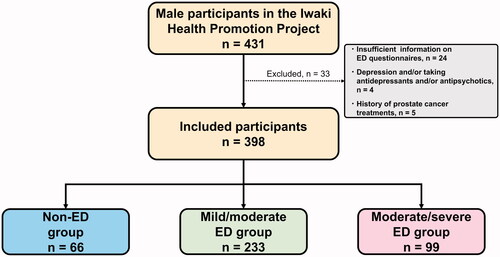
Figure 2. Participant selection of men on dialysis. The number of included and excluded patients is shown. PD: peritoneal dialysis; HD: hemodialysis; ED: erectile dysfunction; 8-OHdG: 8-hydroxy-2'-deoxyguanosine.
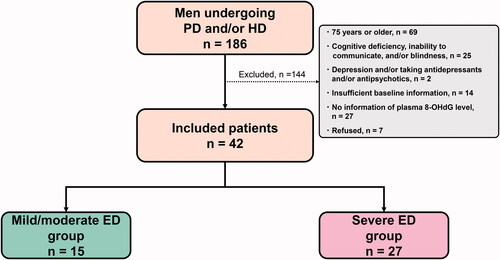
Table 1. Characteristics of community-dwelling men.
Table 2. Characteristics of men on dialysis.
Figure 3. Associations between urine and plasma 8-hydroxy-2'-deoxyguanosine (8-OHdG) levels and the severity of erectile dysfunction (ED). Correlations between urine 8-OHdG level and 5-Item International Index of Erectile Function (IIEF-5) score in community-dwelling men (A) and between plasma 8-OHdG level and Sexual Health Inventory for Men (SHIM) score in men on dialysis (B) were analyzed using Spearman’s rank correlation coefficient. Urine 8-OHdG levels were compared between the three groups using the Kruskal–Wallis test (C). Plasma 8-OHdG levels were compared between the two groups using the Mann–Whitney U test (E). The distribution of the ED degree in community-dwelling men (D) and the prevalence of severe ED in men on dialysis (F) were compared between men with lower and higher 8-OHdG levels using the chi-squared test.
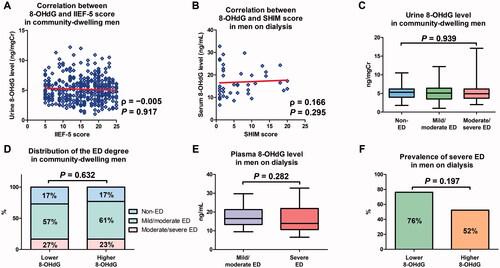
Table 3. Univariable and multivariable analyses for erectile dysfunction in community-dwelling men.
Table 4. Univariable analyses for moderate/severe erectile dysfunction in community-dwelling men with erectile dysfunction.
Table 5. Univariable analyses for severe erectile dysfunction in men on dialysis.