Figures & data
Figure 1. MR images show PDFF (a) and R2* (b) of proximal femur measured in a 76-year-old man with prostate cancer. ROI is manually traced from the femoral head to the horizontal line of the lower end of the lesser trochanter to calculate R2* value and PDFF. PDFF: proton density fat fraction; ROI: region of interest.
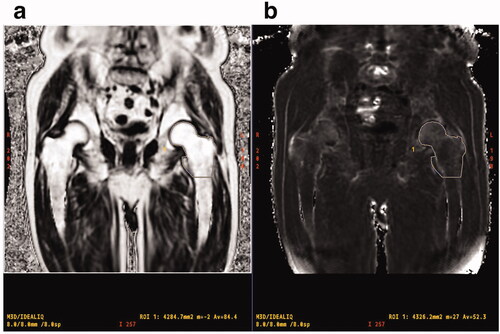
Table 1. Clinical characteristics of study population.
Figure 2. Spearman’s rank correlation coefficient between BMD (g/cm2), MRI-based R2* value (a) and PDFF (b) in proximal femur. R2* values were significantly correlated with BMD compared with PDFF in prostate cancer patients. BMD: bone mineral density; PDFF: proton density fat fraction.
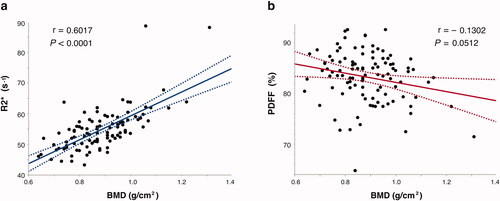
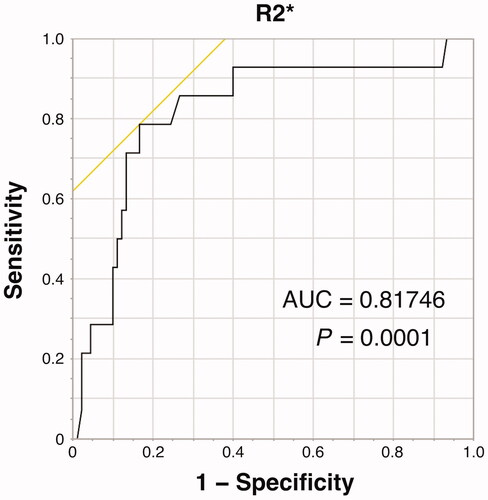
Figure 3. AUC of R2* for distinguishing BMD-T score ≤ −2.5 and > −2.5 was estimated to be 0.817, with cut-off values of 50.7 s−1. AUC: area under the curve; BMD: bone mineral density.