
Figures & data
Table 1. The effects of lead exposure with or without zinc on blood and testicular lead concentrations in male Wistar rats.
Table 2. The effects of zinc on body weight, body weight change, and weights of reproductive organs in lead-treated male Wistar rats.
Figure 1. The effects of zinc on sperm motility (A), viability (B), count (C), daily sperm production, DSP (D), total sperm production, TSP (E) in lead-treated male Wistar rats. Values are mean ± SEM of 5 replicates. Data were analyzed by one-way ANOVA followed by Tukey’s post hoc test. *P < 0.05 vs. control, #P < 0.05 vs. zinc-treated, ∼P < 0.05 vs. lead-treated.
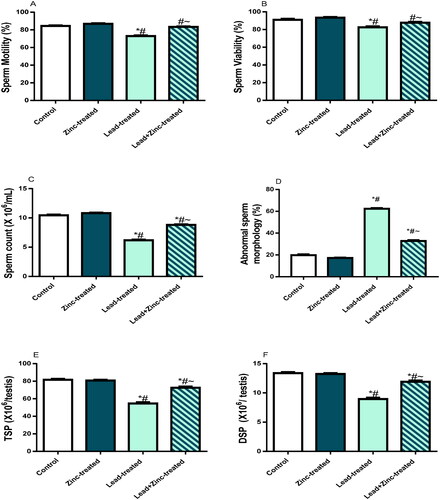
Figure 2. The effects of zinc on serum gonadotropin-releasing hormone, GnRH (A), luteinizing hormone, LH (B), follicle-stimulating hormone, FSH (C), and testosterone (D) in lead-treated male Wistar rats. Values are mean ± SEM of 10 replicates. Data were analyzed by one-way ANOVA followed by Tukey’s post hoc test. *P < 0.05 vs. control, #P < 0.05 vs. zinc-treated, ∼P < 0.05 vs. lead-treated.
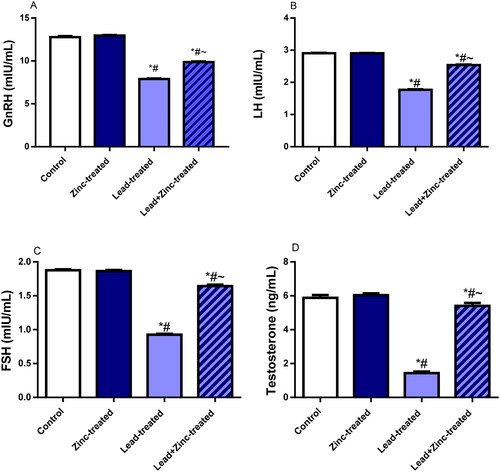
Figure 3. The effects of zinc on testicular 3β-hydroxysteroid dehydrogenase (3β-HSD) (A) and 17β-hydroxysteroid dehydrogenase (17β-HSD) (B) activities in lead-treated male Wistar rats. Values are mean ± SEM of five replicates. Data were analyzed by one-way ANOVA followed by Tukey’s post hoc test. *P < 0.05 vs. control, #P < 0.05 vs. zinc-treated, ∼P < 0.05 vs. lead-treated.
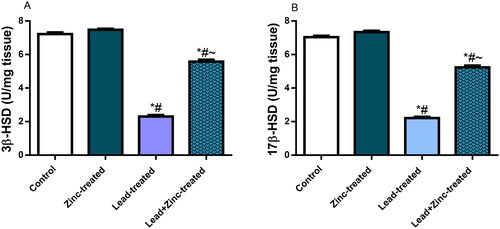
Figure 4. The effects of zinc on testicular xanthine oxidase activity (A), uric acid level (B), Malondialdehyde, MDA, level (C) reduced glutathione, GSH, level (D), activities of superoxide dismutase, SOD (E) and catalase (F), total antioxidant capacity, TAC (G) and nuclear factor erythroid 2-related factor 2, Nrf2 concentration (H) in lead-treated male Wistar rats. Values are mean ± SEM of 5 replicates. Data were analyzed by one-way ANOVA followed by Tukey’s post hoc test. *P < 0.05 vs. control, #P < 0.05 vs. zinc-treated, ∼P < 0.05 vs. lead-treated.
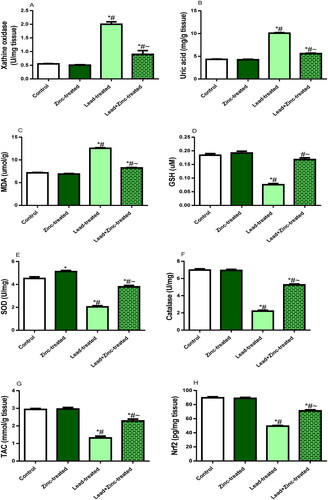
Figure 5. The effects of zinc on testicular TNF-α (A), IL-1β uric acid (B), and nuclear factor kappa B, NFkB (C) concentrations in lead-treated male Wistar rats. Values are mean ± SEM of 5 replicates. Data were analyzed by one-way ANOVA followed by Tukey’s post hoc test. *P < 0.05 vs. control, #P < 0.05 vs. zinc-treated, ∼P < 0.05 vs. lead-treated.
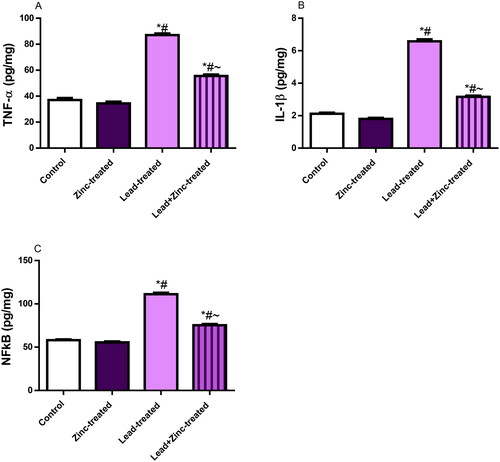
Figure 6. The effects of zinc on testicular caspase 3 activity (A) and DNA fragmentation index, DFI (B) in lead-treated male Wistar rats. Values are mean ± SEM of 5 replicates. Data were analyzed by one-way ANOVA followed by Tukey’s post hoc test. *P < 0.05 vs. control, #P < 0.05 vs. zinc-treated, ∼P < 0.05 vs. lead-treated.
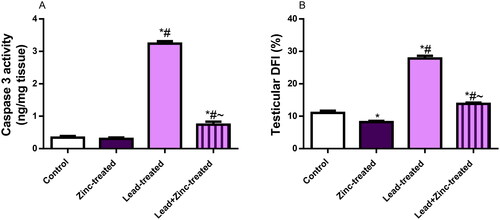
Figure 7. Representative photomicrographs showing the effects of zinc on testicular histoarchitecture in lead-treated male Wistar rats. The vehicle-treated control and zinc-treated rats show preserved testicular histoarchitecture. The seminiferous tubules (black arrow) appear normal in shape and size with normal germ cell lines (red arrow) at varying degrees of maturation. The lumen appears normal with normal mature sperm cells (black circle). The interstitial space also appears normal with intact Leydig cells (red circle). Lead exposure led to alterations in the testicular histoarchitecture. The seminiferous tubules (black arrow) appear reduced and contain sloughed germ cells (red arrow). There are scanty sperm cells within the tubular lumen (black circle). The interstitium appears normal but with degenerated/reduced Leydig cells (red circle). Zinc treatment in lead-exposed rats preserved the testicular histoarchitecture. The seminiferous tubules (black arrow) appear normal in shape and size with normal germ cell lines (red arrow) at varying degrees of maturation. The lumen appears normal with normal mature sperm cells (black circle). The interstitial space also appears normal with intact Leydig cells (red circle).
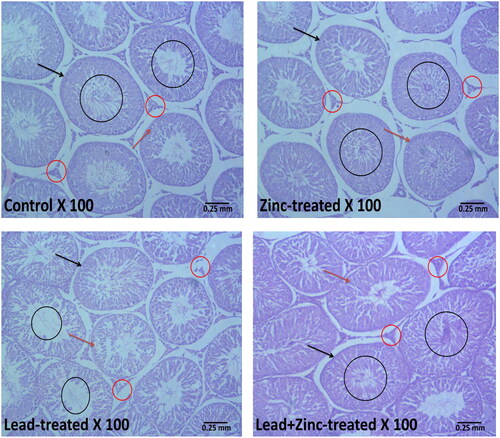
Figure 8. The effects of zinc on testicular seminiferous tubular diameter (A), luminal diameter (B), epithelial height (C) and histoarchitecture using Cosentino’s score (D) in lead-treated male Wistar rats. Values are mean ± SEM of 5 replicates. Data were analyzed by one-way ANOVA followed by Tukey’s post hoc test. *P < 0.05 vs. control, #P < 0.05 vs. zinc-treated, ∼P < 0.05 vs. lead-treated.
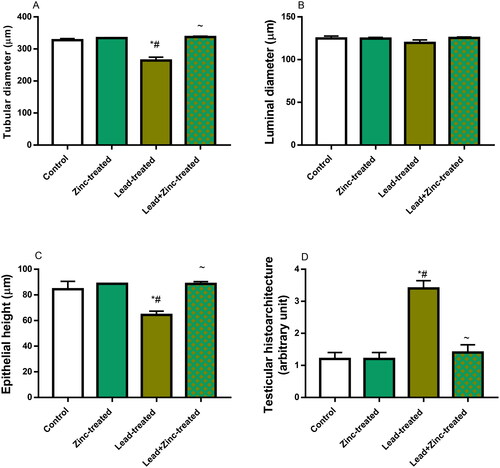
Figure 9. The effects of zinc on germ cell count; spermatogonial (A), spermatocytes (B), spermatids (C) and mean testicular biopsy score, MTBS, using Johnsen’s score (D) in lead-treated male Wistar rats. Values are mean ± SEM of 5 replicates. Data were analyzed by one-way ANOVA followed by Tukey’s post hoc test. *P < 0.05 vs. control, #P < 0.05 vs. zinc-treated, ∼P < 0.05 vs. lead-treated.
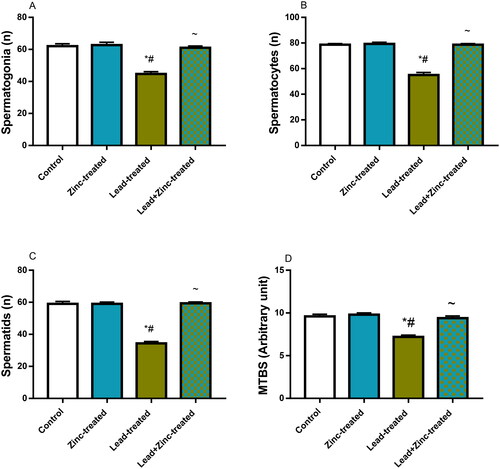
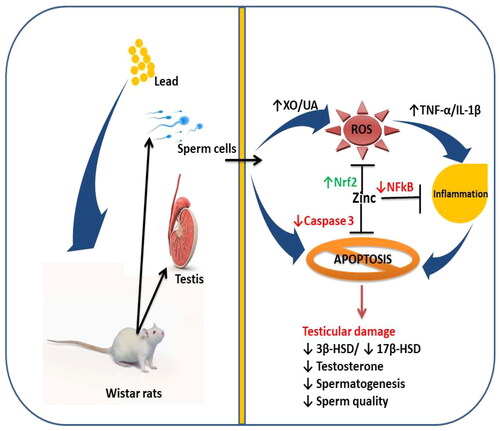
Figure 10. A schematic diagram illustrating how zinc ameliorates lead-induced testicular damage. XO: Xanthine oxidase; UA: uric acid; ROS: reactive oxygen species; TNF-α: tumour necrotic factor-alpha; IL-1β: interleukin-1beta; Nrf2: nuclear factor erythroid 2-related factor 2; α: nuclear factor kappa B; 3β-HSD: 3β-hydroxysteroid dehydrogenase; 17β-HSD: 17β-hydroxysteroid dehydrogenase.
Data availability statement
Data will be made available upon reasonable request from the corresponding author.