
Figures & data
Figure 1. Flow chart of literature retrieval and inclusion.
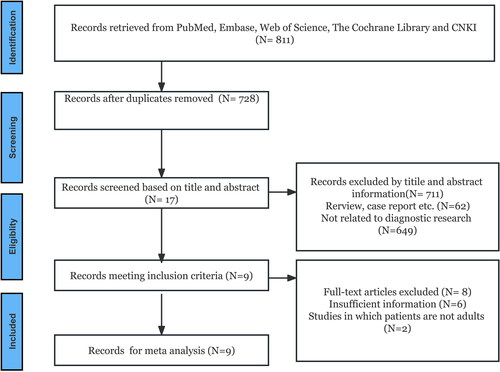
Table 1. The study and patients’ basic characteristics of the included studies.
Table 2. Diagnostic accuracy and cut-off values from included studies.
Figure 2. Forest plot of pooled (A) sensitivity (SEN), (B) specificity (SPE), (C) positive likelihood ratio (PLR), (D) negative likelihood ratio (NLR), (E) diagnostic odds ratio (DOR), and (F) area under the curve (AUC) of Summary Receiver Operating Characteristic (SROC). (G) The Fagan’s nomogram.
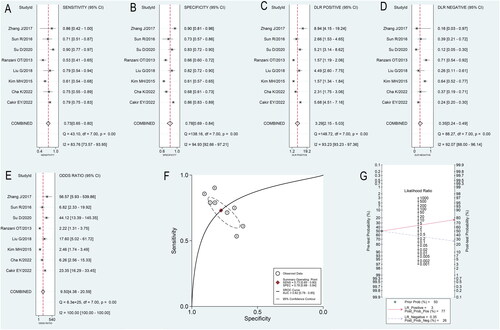
Figure 3. (A) Univariate meta-regression and subgroup analyses results. (B) The results of publication bias.
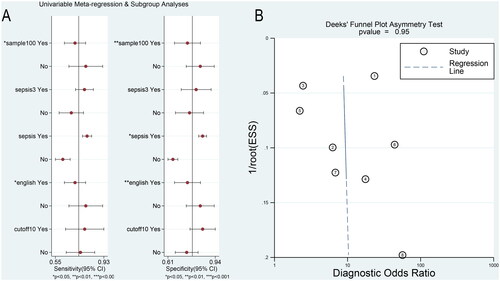
Table 3. Results of univariable meta-regression and subgroup analyses.
Figure 4. Influence analysis and outlier detection. (A) Goodness-of-fit, (B) bivariate normality, (C) influence analysis, and (D) outlier detection.
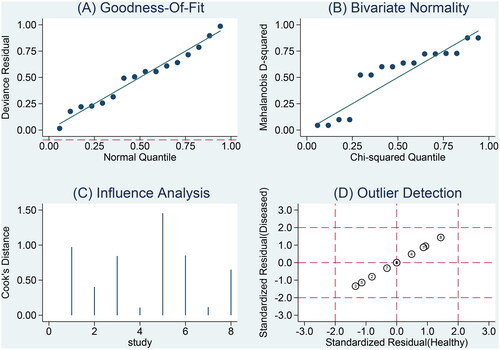
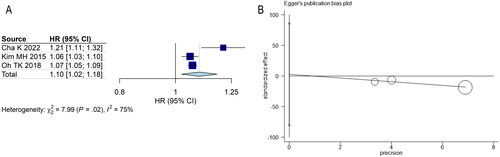
Figure 5. (A) Forest plots evaluating the hazard ratio (HR) of CAR in patients with sepsis. (B) The results of publication bias.
Supplemental Material
Download Zip (1.6 MB)Data availability statement
All data generated or analyzed during this study are included in this published article. The data supporting this study’s findings are available from the corresponding author upon reasonable request.