
Figures & data
Table 1. Characteristics of patients with pre-diabetes mellitus by HbA1c level.
Table 2. The spearman’s association analysis among indicators in pre-diabetes mellitus.
Table 3. Risk factors for pre-diabetes mellitus by multivariate logistic regression analysis.
Figure 1. ROC curves for the factors associated with HbA1c (A), FPG (B), and 2hPG (C) in prediabetes. FPG: Fasting plasma glucose; HbA1c: glycosylated hemoglobin; 2hPG: 2-hour postprandial blood glucose; TG: triglyceride; TC: total cholesterol; HDL-C: high-density lipoprotein cholesterol; LDL-C: low-density lipoprotein cholesterol; UA: uric acid; BMI: body mass index; WC: Waist circumference.
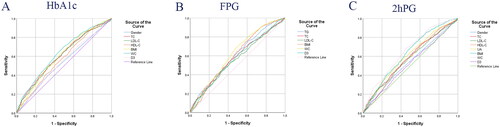
Table 4. The impact of indicators on pre-diabetes mellitus diagnosis.
Data availability statement
The datasets generated and/or analyzed in the current study cannot be made public due to the potential for subsequent analysis of the data but may be obtained from the corresponding authors upon reasonable request.