Figures & data
Table 1. Differences between CD4/CD8 > 1 group and CD4/CD8 < 1 group.
Table 2. Percent expression of lymphocyte subsets in elderly males categorized by their serum prealbumin levels.
Table 3. Percent expression of lymphocyte subsets in elderly males categorized by their serum transferrin levels.
Table 4. Percent expression of lymphocyte subsets in elderly males categorized by their serum albumin levels.
Figure 1. Correlation analysis between PEM and T-cell subsets. A–F) Correlation between PEM parameters (prealbumin, transferrin, and albumin) and CD4/CD8 ratio, proportions of CD4+ cells, CD8+ cells, CD3+CD28+ cells, CD4+CD28+ cells, and CD8+CD28− cells. Red indicates prealbumin, blue indicates transferrin, and brown indicates albumin. PEM: protein energy malnutrition.
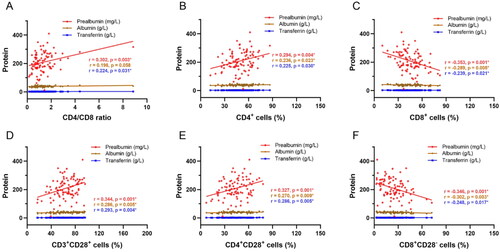
Figure 2. Correlation analysis between PEM and age. A–C) Correlation between PEM parameters (prealbumin, transferrin, and albumin) and age. Red indicates prealbumin, blue indicates transferrin, and brown indicates albumin. PEM: protein energy malnutrition.
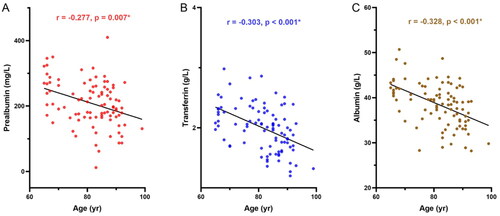
Figure 3. Correlation analysis between age and proportions of T-cell subsets. A–F) Correlation between age and CD4/CD8 ratio, proportions of CD4+ cells, CD8+ cells, CD3+CD28+ cells, CD4+CD28+ cells, and CD8+CD28− cells.
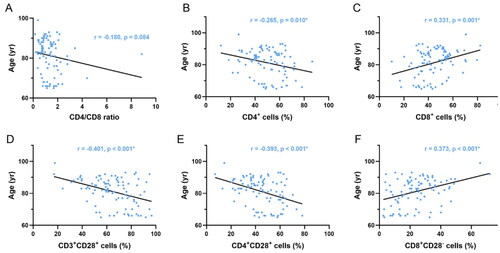
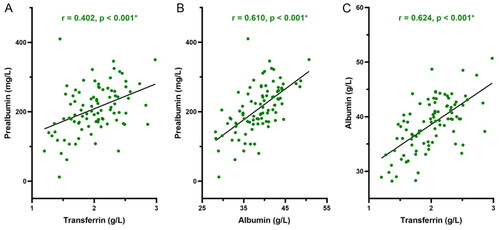
Figure 4. Correlation analysis between different PEM parameters with one another. A) Correlation between prealbumin and transferrin. B) Correlation between prealbumin and albumin. C) Correlation between transferrin and albumin.