
Figures & data
Figure 1. Flow chart of participants’ enrollment in the study.
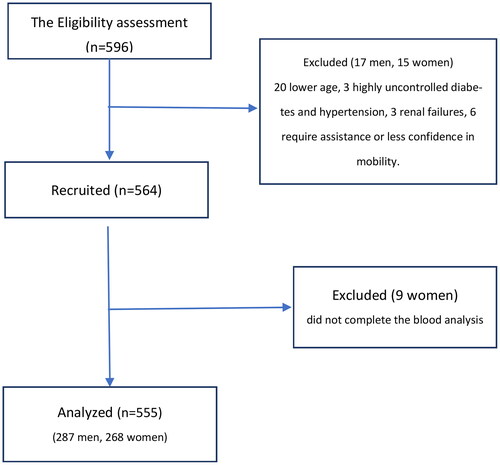
Table 1. Comparison of clinical characteristics and adiposity indices based on HGS cut-off for values of probable sarcopenia in men and women.
Table 2. Comparison of clinical characteristics, adiposity indices, and HGS in control and patients with MetS.
Table 3. ROC analysis for all participants and separately for both genders using MetS and its components as dicotomus in relation to HGS and different adiposity indices ratios.
Table 4. Odd ratios of HGS (adjusted to age and gender) based on the quartiles for MetS.
Table 5. Linear regression analysis for metabolic syndrome components with age, handgrip strength, and body composition.
Table 6. Logistic regression analysis for MetS.
Supplemental Material
Download MS Word (17 KB)Data availability statement
All the associated data is available in the manuscript.