
Figures & data
Table 1. AMSS and ΔAMSS values in men on/not on TU at 6-monthly follow-up intervals.
Figure 1. Graphical illustration of the association (based on – Model 1) between ΔAMSS after 60 months and baseline AMSS values.
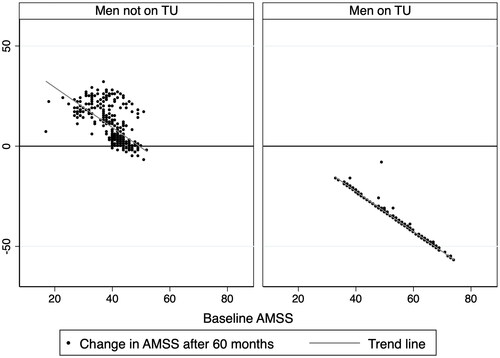
Figure 2. A grid of the number of men in AMSS at baseline and 60 months follow-up, categorized into symptoms-based subgroups. AMSS categories by symptoms associated with low testosterone levels. 17–26: no significant symptoms; 27–36: mild symptoms; 37–49: moderate symptoms; >49: severe symptoms.
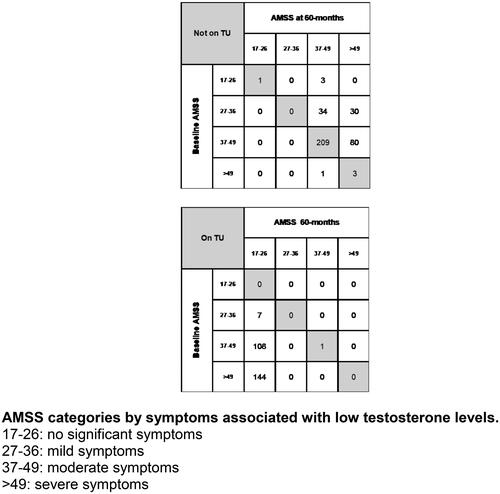
Table 2. Results from linear/multiple regression models with ΔAMSS after 60 months as the dependent variable and baseline AMSS and other metabolic factors as independent variables – separate models were carried out in men on/not on TU.
Data availability statement
All reasonable requests for data should be directed to corresponding author.