
Figures & data
Table 1. WHO semen analysis normal values, 2021.*
Table 2. Descriptive characteristics of 8046 cases. The data are shown as mean ± standard deviation (SD) or % and number (n).
Figure 1. Pie chart demonstrating the distribution of men with normozoospermia, oligozoospermia, oligoasthenozoospermia, azoospermia, and asthenozoospermia based on the sixth edition of the WHO laboratory manual for the examination and processing of human semen, 2021.
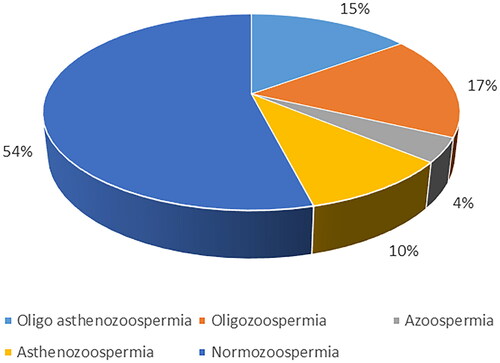
Table 3. Comparison of semen parameters, pregnancy and live birth rates according to the paternal age.
Table 4. Pregnancy and live birth rates by maternal age.
Data availability statement
The datasets analyzed in the present study include all data of a IVF center. Due to the potential for further analysis of the data, it cannot be made publicly available. However, it may be obtained from the corresponding authors upon request.