Figures & data
Table 1. OLS-regression model predicting anti-establishment populist attitudes.
Table 2. OLS-regression model predicting exclusionist populist attitudes.
Figure 1. Interaction effect of blame attribution to the government and source support on anti-establishment populist attitudes.
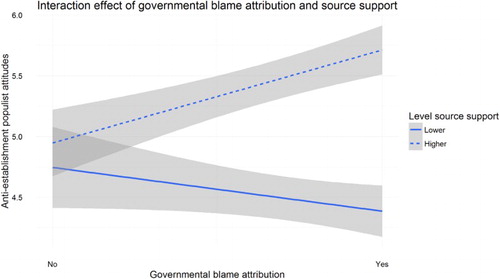
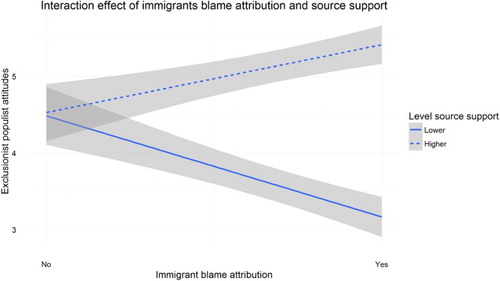
Figure 2. Interaction effect of blame attribution to immigrants and source support on exclusionist populist attitudes.