Figures & data
Figure 1. Resources and appropriation theory (simplified), Van Dijk (Citation2005).
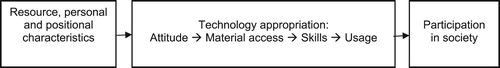
Table 1. Demographic profiles.
Table 2. Items used for measuring IoT attitude and skills.
Figure 2. IoT devices (smart) used for health purposes (% of Dutch adult population).
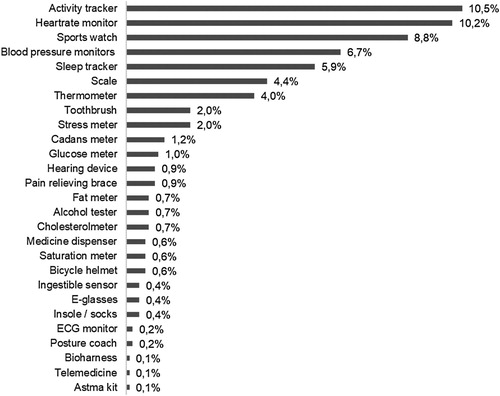
Figure 3. IoT devices (smart) used for home purposes (% of Dutch adult population).
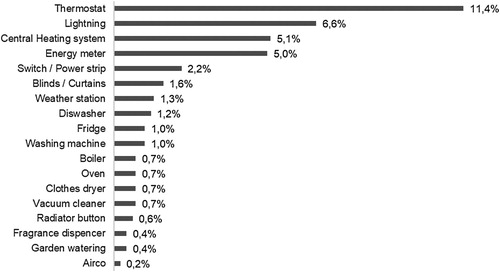
Figure 4. IoT devices (smart) used for home purposes (% of Dutch adult population).
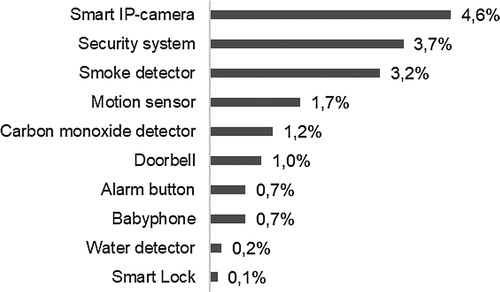
Table 3. Regression analysis to predict attitudinal (OLS) and material IoT access (Logistic).
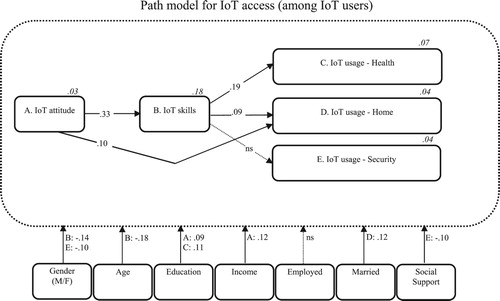
Figure 5. Path model for IoT access (among IoT users).
Note: n = 563 IoT users. Paths significant at .05 level; path from attitudinal IoT access to usage IoT access – Home was added to improve model fit. R2’s in italic.