Figures & data
Figure 1. (A) Mapping of online jobs to SOC: 1. the category, title, required skills and details of all online projecs are fed into the SOCcer classifier. 2. The tool yields ten suggested SOC codes per project. 3. The results are manually inspected and matched with the most likely and reasonable SOC occupation. (B) Educational attainment distributions of different occupations, used to calculate a required skill score per occupation (C) Derived required skill scores of all occupations in the dataset, which vary substantially between the categories.
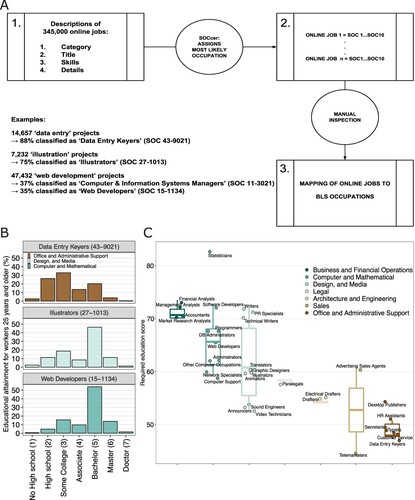
Figure 2. (A–B) Distributions of the number of projects per capita and relative online skill score in metropolitan, micropolitan, and rural counties. Rural counties tend to supply more online labour that is of higher skill level than urban areas. (C) Summary statistics of online labour demand and supply, skill level, population and economic factors in metropolitan, micropolitan, and rural counties. (D–F) Distributions of the number of median household income, county education score, and broadband speed in metropolitan, micropolitan, and rural counties. Rural counties, on average, show lower values than urban areas.
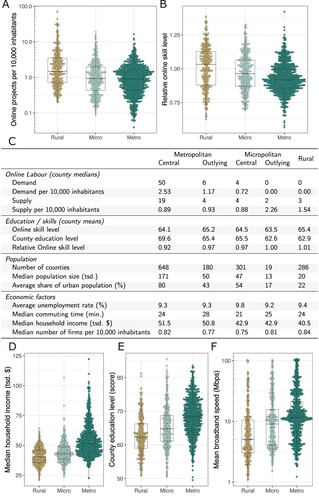
Figure 3. (A) Regression models associating the number of online labour projects and the relative online skill level to regional indicators and socio-economic control variables: rural areas provide significantly more and higher skilled online labour than urban centres. (B–C) Out-of-sample Mean Absolute Error and Pearson Correlation Coefficient: the zero-inflated negative binomial model performs best (dots represent cross-validated prediction results; error bars show ).
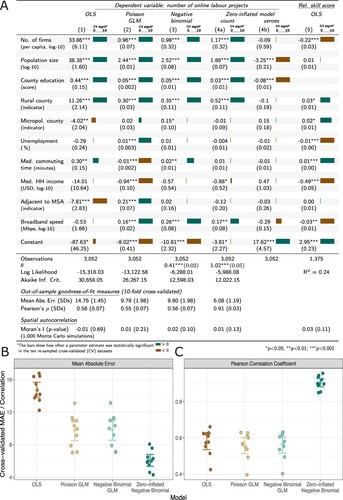
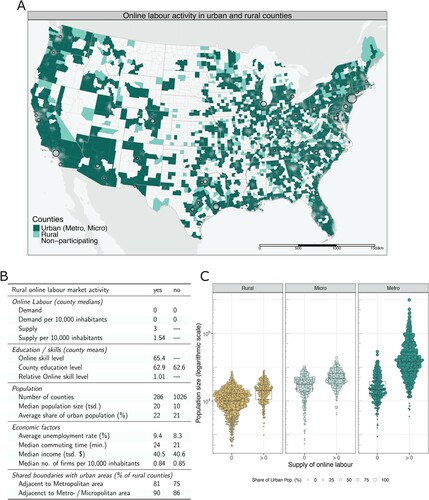
Figure 4. (A) US continental map highlighting urban areas (dark green) and rural counties (light green) supplying online labour, and non-participating counties (white). (B) Summary statistics of participating and non-participating rural counties. (C) Distribution of population size and share of urban population in participating and non-participating metropolitan, micropolitan, and rural counties: independently of the county type, it is the less populated and less urbanised counties that do not participate.