Figures & data
Table 1. Experiment interview questions from the ADDS validation from O’Shea et al. (Citation2018).
Table 2. Performance of the ADDS in the validation experiment.
Table 3. Confusion matrix of conditional probabilities of the ADDS.
Table 4. Joint probability matrix of expected performance of the ADDS for a context of 5% of liars (prior probability of 0.05).
Figure 1. Event tree to explain deception detection probability of each outcome. In this case we test the hypothesis of 1% of liars in the population.
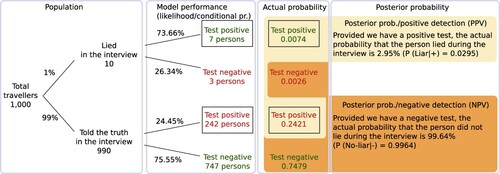
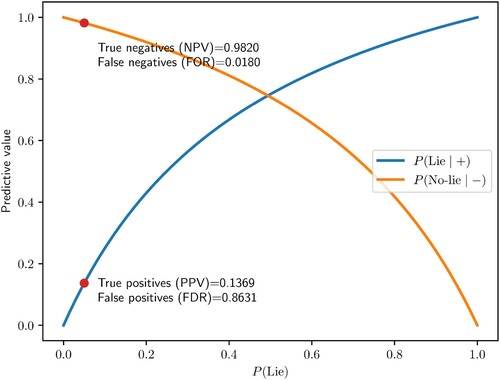
Figure 2. Posterior probabilities of a positive and negative test for different scenarios of the frequency of deception. Highlighted values correspond to the scenario of 5% of liars. While the conditional probability is fixed, the probability of someone being a liar after a positive test depends on the general population.