
Figures & data
Table 1. Means, Standard Deviations, and Bi-variate Correlations (Study 1).
Table 2. Means and Standard Deviations (Study 2).
Figure 1. Conditional LCM-SR with four repeated measures for social media use (s) and populist attitudes (p). Factor loadings for slopes (β) are set to 0, 1, 2, 3; for intercepts (α) to 1, 1, 1, 1; for residuals (ϵ) to 1. Full lines represent the final model following a strict modeling strategy. Full lines combined with dashed lines represent the final model following a loose modeling strategy.
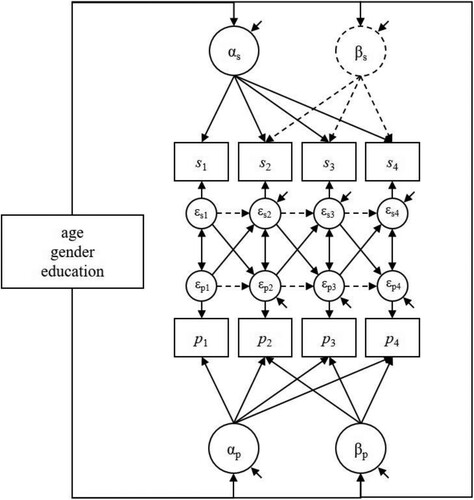
Table 3. Intraindividual autoregressive, cross-lagged, contemporaneous, and indirect effects.
Table 4. Covariance, variance matrix for latent growth factors.
Supplemental material
