
Figures & data
Table 1. Summary of relevant empirical literature studying the potential predictiveness of Wikipedia pageviews on electoral outcomes.
Figure 1. Distribution of vote share and pageview ratio among House candidates.
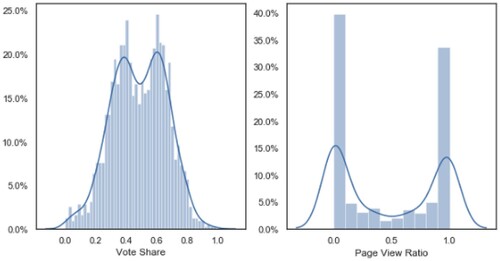
Figure 2. The monthly cumulative rate (above) and weekly non-cumulative pageview rate (below) predicting variance in vote share throughout the election year.
Note: p < .001 across each observation throughout the election.
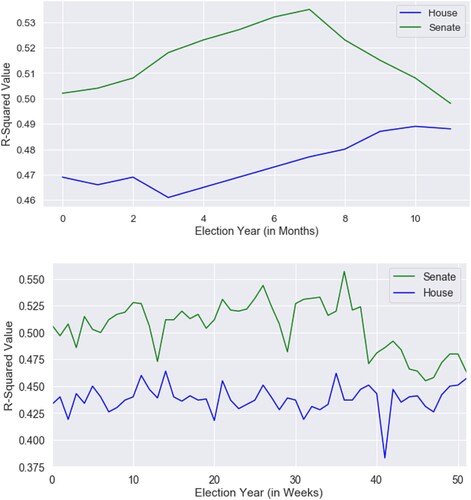
Table 2. Regression analysis predicting vote share from pageview ratio (Model 1), challenger status (Models 2, 3 and 4) and race type (Model 5).
Figure 3. Average pageview ratio of incumbents and challengers throughout election cycle (a) and relationship between pageview ratio and candidate types (b).
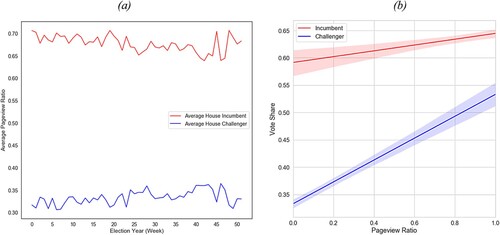
Table 3. Regression analysis predicting vote share from pageview ratio (Model 1) and viability ratio (Models 2–6).
Figure 4. Proportion of variance in pageview ratio predicted by media coverage ratio for incumbents and challengers.
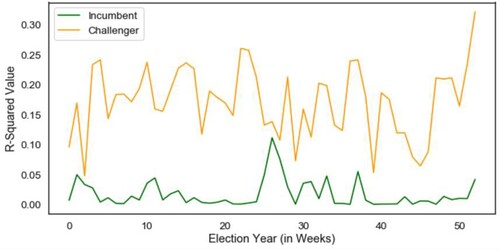
Table 4. Regression analysis predicting vote share from pageview ratio (Model 1), news ratio (Models 2–4).
Table 5. All possible variable value combinations and the corresponding probability of challenger victory.