
Figures & data
Table 1. Cross-country comparison of data collected through CTAs.
Figure 1. Conceptual framework.
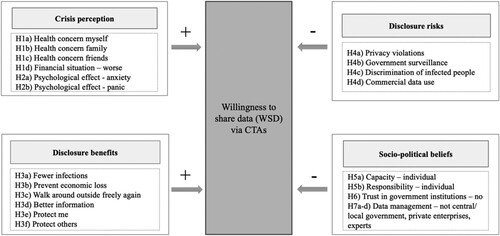
Table 2. Demographic composition of the sample and the total population.
Table 3. Summary of independent variables.
Figure 2. Willingness to share different types of data through CTAs by country.
Note: Sample size = 6464; weighted sample, numbers = percent.
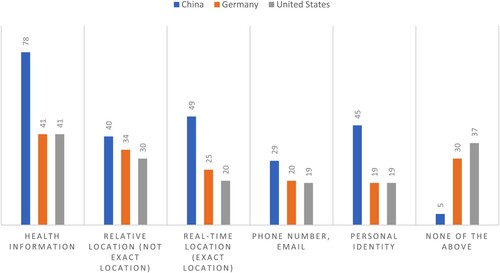
Figure 3. Odds ratios of effects on willingness to share any type of data through CTAs.
Note: For brevity and clarity reasons, control variables are not shown in the graph, but have been included in the model. *p .05; **p < .01; ***p < .001.
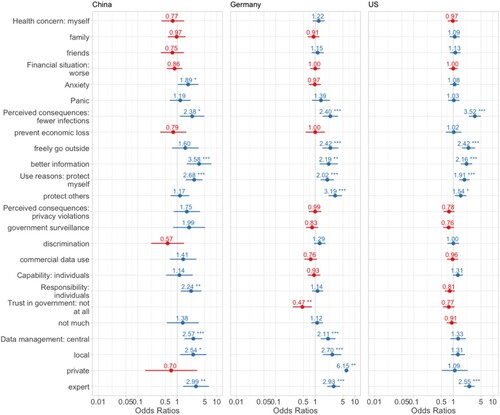
Figure 4. Odds ratios of effects on willingness to share health information.
Note: For brevity and clarity reasons, control variables are not shown in the graph, but have been included in the model. p < .05; **p < .01; ***p < .001.
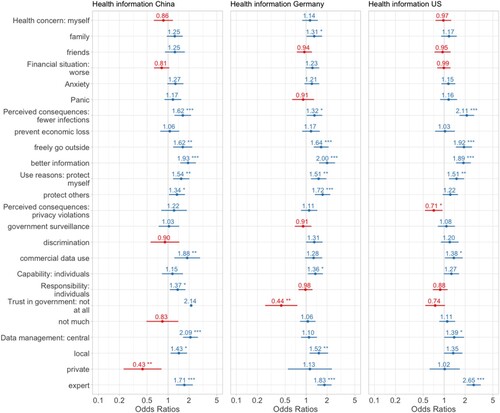
Figure 5. Odds ratios of effects on willingness to share relative location data.
Note: For brevity and clarity reasons, control variables are not shown in the graph, but have been included in the model. *p < .05; **p < .01; ***p < .001.
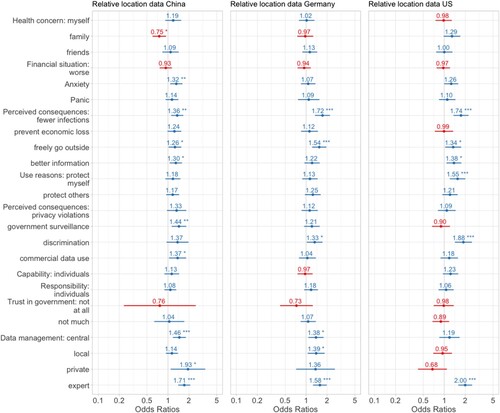
Figure 6. Odds ratios of effects on willingness to share real location data.
Note: For brevity and clarity reasons, control variables are not shown in the graph, but have been included in the model. p < .05; **p < .01; ***p < .001.
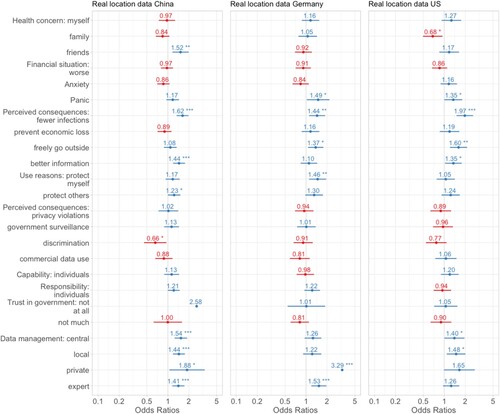
Figure 7. Odds ratios of effects on willingness to share personal identity.
Note: For brevity and clarity reasons, control variables are not shown in the graph, but have been included in the model. *p < .05; p < .01; ***p < .001.
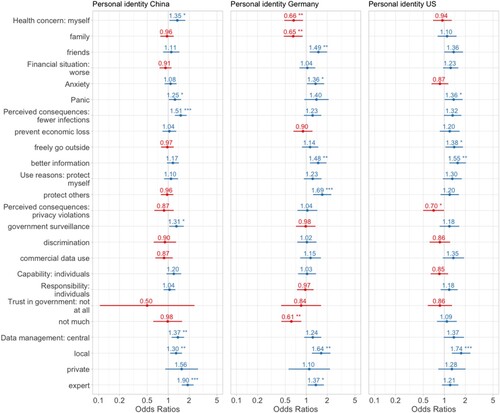
Table 4. Overview of hypotheses for willingness to share any type of data through CTAs.
Figure A1. Odds ratios of effects on willingness to share phone number and email address.
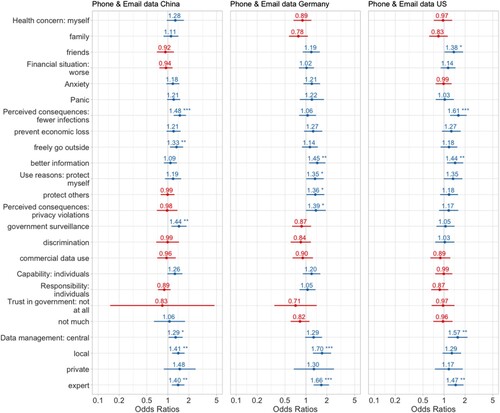
Figure A2. Full sample – Odds ratios of effects on willingness to share any data.
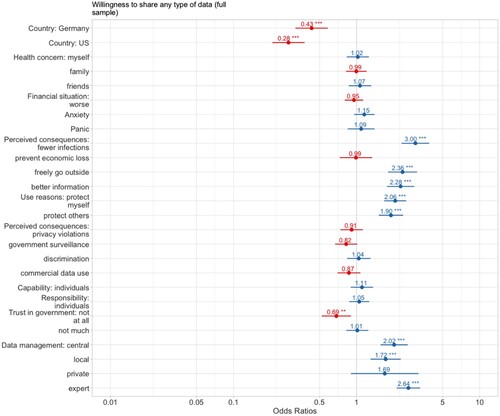
Table A1. Hosmer-Lemeshow and AUC tests
Table A2. Variance inflation factors (VIFs)
Table A3. Hypotheses results for different types of data