Figures & data
Table 1. Actor types addressed by parties’ digital connections, May 2019, in percent.
Table 2. Top 20 accounts connected to by parties in Tweets in May 2019, per countries, indegree (ID).
Table 3. Functions of parties’ digital connections (top-down), in percent.
Table 4. Actor types of user interactions with parties, May 2019, in percent.
Table 5. Functions of user interactions with parties, in percent.
Figure 1. Networked communication ecology of RRPs and interacting users, May 2019.
Basis: References in parties' and frontrunners' Tweets and interactions with parties and frontrunners in May 2019, n=1427 nodes and 91,724 connections, created with network, igraph, ggplot2 and sna packages in R. Layout: Fruchterman–Reingold. Node size represents indegree, edge strength shows tie weight. Edge color in red if an edge runs between two nodes from different countries or between supranational actors and domestic ones. Edge color in gray if the edge runs between two national actors (nodes) belonging to the same country.
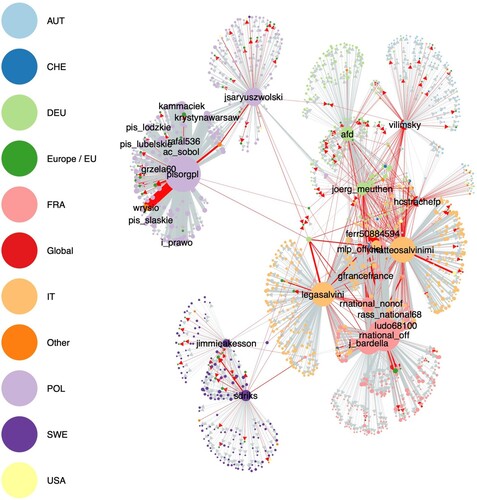
Figure 2. E-I-Index, Transnationality based on actor scope and country, May 2019.
Basis: E-I-value ranges from -1, meaning all connections are internal/domestic, to +1, meaning all connections are external/transnational. Yellow star represents mean EI-Index per country, individual dots represent distribution of individual actors. Number of actors: AUT = 134, DEU = 208, FRA = 225, IT = 308, POL = 266, SWE = 158.
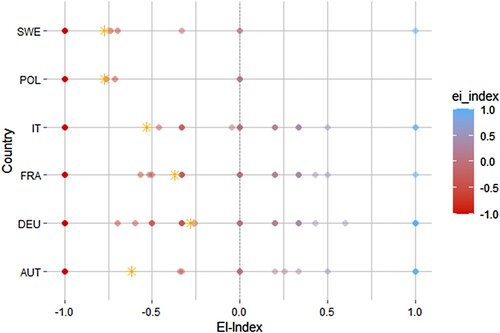
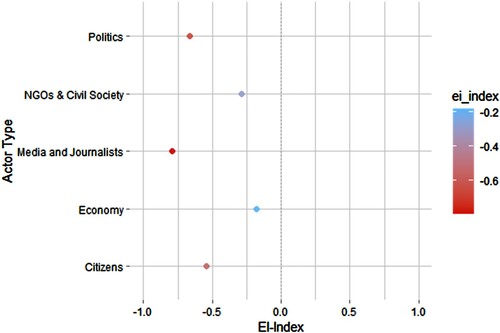
Figure 3. E-I-Index, Transnationality based on actor type, May 2019.
Basis: E-I-value ranges from -1, meaning all connections are internal/domestic, to +1, meaning all connections are external/transnational. Mean EI-Index by Actor Type. Number of actors: Politics = 443, NGOs & Civil Society = 22, Media and Journalists = 321, Economy = 22, Citizens = 613. Actor categories not displayed due to small n: Other = 2, Culture = 4.