
Figures & data
Table 1. Overview of news outlets. Newspapers sampled for comparison, n = 920.
Table 2. Watchdog role indicators.
Table 3. Watchdog role performance and cited sources in news coverage. The index was created by dividing the number of present indicators by the total number of indicators and ranges from 0 to 1.
Table 4. The presence of individual indicators across outlets, in percentage (n = 920).
Figure 1. Relative visibility of Big Tech Corporations in news coverage.
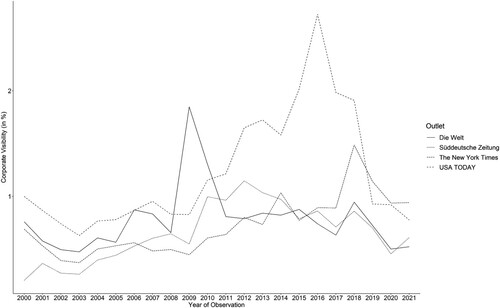
Figure 2. Over-time development of the interventionist and detached watchdog role orientation, indexed on a scale of 0–1.
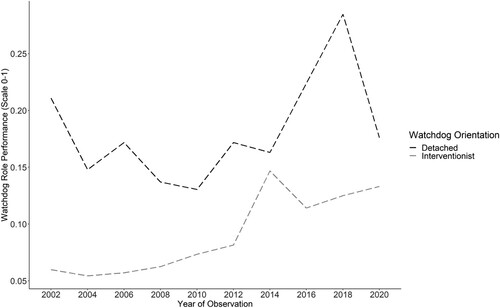
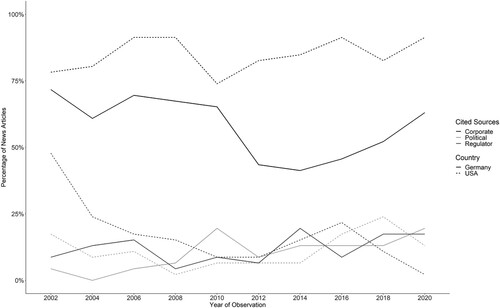
Figure 3. Over-time patterns of cited sources in news coverage on Big Tech across Germany and the United States (2000–2020).
Data availability statement
The data that support the findings of this study are openly available at Open Science Framework: https://osf.io/ge64b/?view_only=02837cd9092147ef8f55a608a95607ea.