Figures & data
Table 1. Sample structure of the survey (%).
Figure 1. Employment services scenario index values. A higher score indicates a more positive attitude towards the scenario.
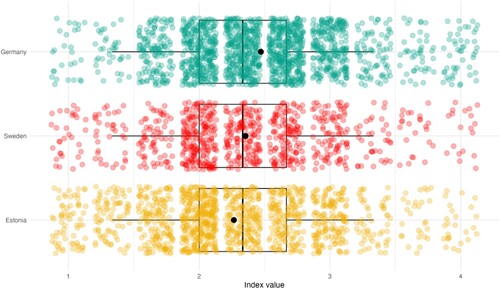
Figure 2. Social services scenario index values. A higher score indicates a more positive attitude towards the scenario.
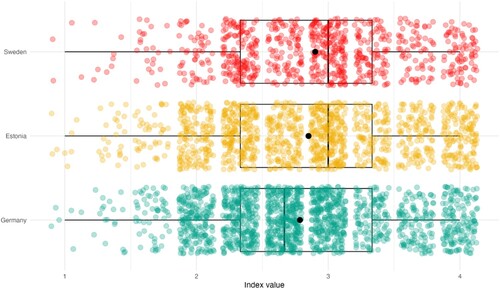
Figure 3. Predictive policing scenario index values. A higher score indicates a more positive attitude towards the scenario.
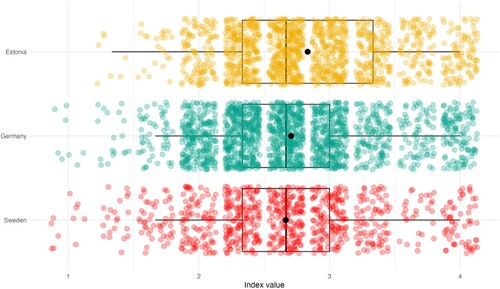
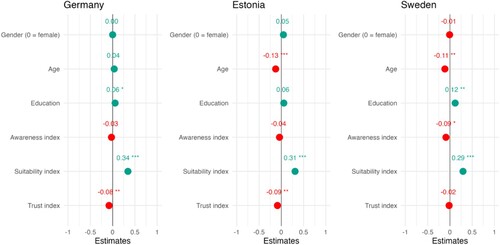
Figure 4. Results of a multiple linear regression conducted to predict index values in the employment services scenario. R2 (Adj. R2) – DE: .14 (.13), EST: .28 (.28), SE: .23 (.22). * = p ≤ 0.05, ** = p ≤ 0.01, *** = p ≤ 0.001.
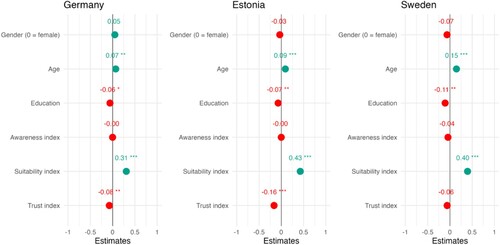
Figure 5. Results of a multiple linear regression conducted to predict index values in the employment services scenario. R2 (Adj. R2) – DE: .25 (.24), EST: .24 (.23), SE: .18 (.17). * = p ≤ 0.05, ** = p ≤ 0.01, *** = p ≤ 0.001
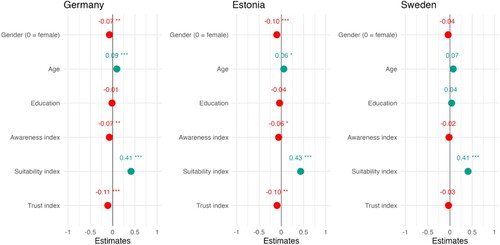
Figure 6. Results of a multiple linear regression conducted to predict index values in the predictive policing scenario. R2 (Adj. R2) – DE: .15 (.14), EST: .14 (.13), SE: .11 (.10). * = p ≤ 0.05, ** = p ≤ 0.01, *** = p ≤ 0.001.