
Figures & data
Table 1. T1 variables associated with participation at T3.
Table 2. Descriptive statistics showing the number of children in each category (N) and the percentage of the total sample (%).
Figure 1. Children’s Possibility for contact with parents. Results given as the percentage at each timepoint.
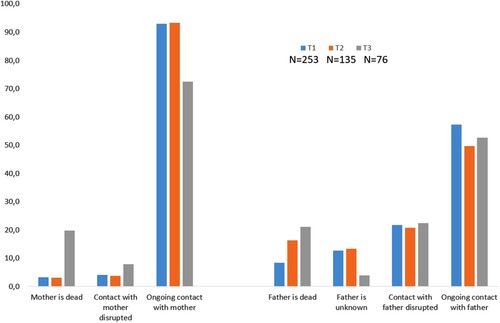
Table 3. Frequency of contact with the parents for respondents having a living mother or father at the particular timepoint.
Table 4. Linear mixed models examining Frequency of contact with parents through time as a function of Type of placement 2 and Sex of the child.
Table 5. Linear mixed models examining Frequency of contact with parents through time as a function of Type of placement 3 and Sex of the child.