Figures & data
Figure 1. Unconditional Expectations to Attain Tertiary Education across Migrant Status and Migration Expectations. Source: Own calculations from CEPS 2013–2014. Percentages are weighted.
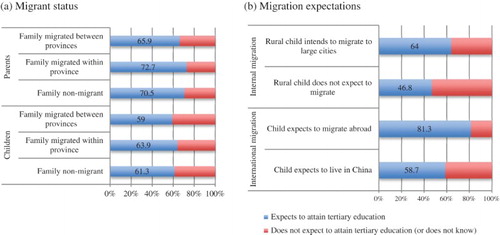
Figure 2. Differences in the expectation of attaining higher education by Migrant status.
Note: TE-IPWRA population means and 95% confidence intervals obtained from models shown in Table A3.
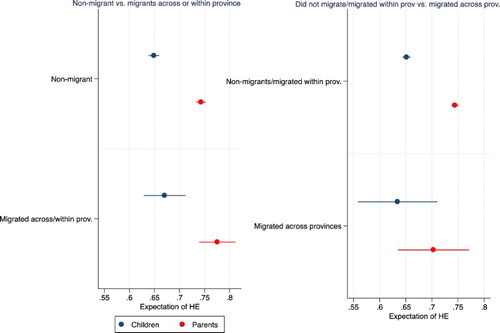
Figure 3. Effect of migration expectations on expectations of attaining higher education.
Note: Estimates and 95% confidence intervals obtained from LPM (school fixed effects) 1 and 2 in Table A4.
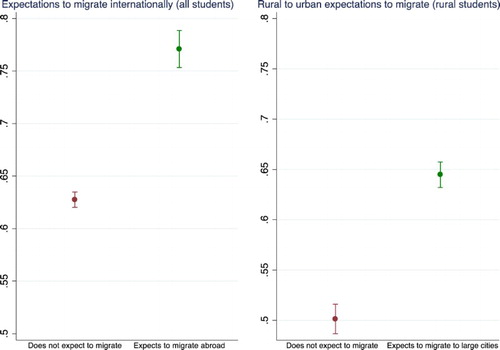
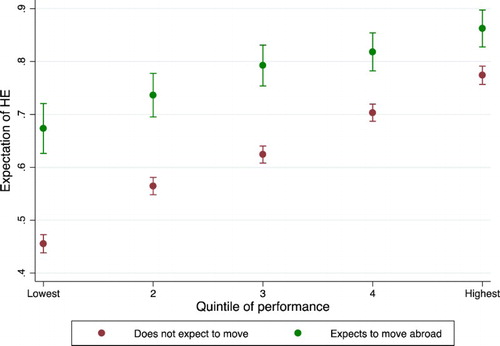
Figure 4. Expectations of attaining tertiary education by quintile of performance and intentions to migrate internationally.
Note: Estimates and 95% confidence intervals obtained from LPM 3 (school fixed effects) in Table A4.