Figures & data
Table 1. Numbers and background characteristics by origin, cohort June 2010.
Figure 1. Share of employees employed in the months June 2010 – December 2015 (monthly observations) June 2010 cohort.
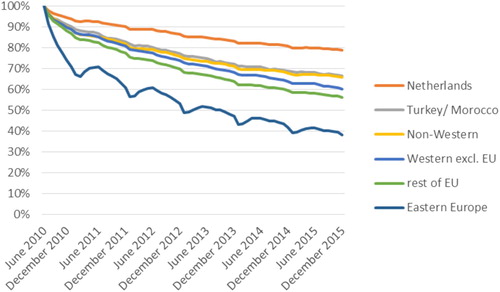
Figure 2. Number of months worked in a calendar year, Central and Eastern European labour migrants, June 2010 cohort.
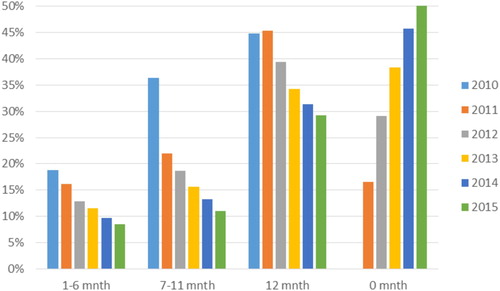
Table 2. Numbers and background characteristics by working pattern type in 2010, June 2010 cohort of labour migrants from Central and Eastern Europe.
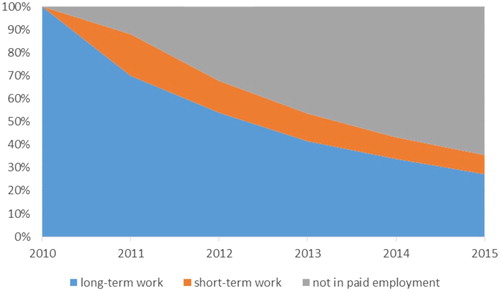
Figure 3. ‘Short-term work and registered’ working pattern in 2010 and trend in the subsequent period 2011–2015, Central and Eastern European labour migrants, June 2010 cohort (N = 3399).
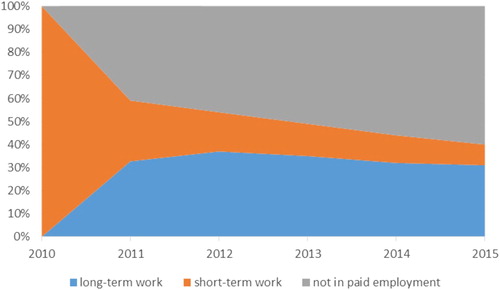
Figure 4. ‘Short-term work and not registered’ working pattern type in 2010 and trend in the subsequent period 2011–2015, Central and Eastern European labour migrants, June 2010 cohort (N = 23,632).
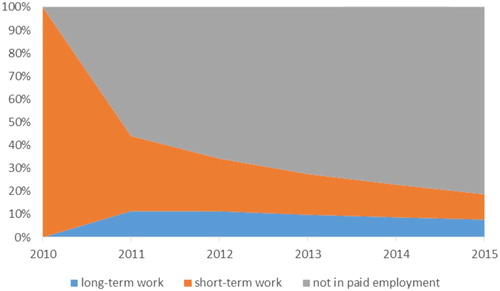
Figure 5. ‘Long-term work and registered’ working pattern type in 2010 and trend in the subsequent period 2011–2015, Central and Eastern European labour migrants, June 2010 cohort (N = 62,452).
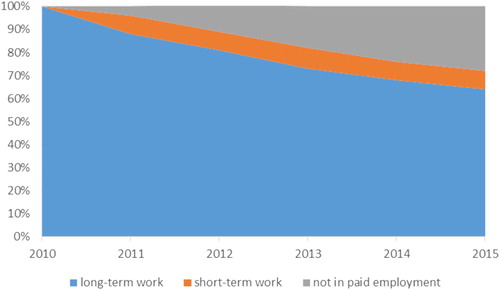
Figure 6. ‘Long-term work and not registered’ working pattern type in 2010 and trend in the subsequent period 2011–2015, Central and Eastern European labour migrants, June 2010 cohort 2010 (N = 54,220).