2,796
Views
7
CrossRef citations to date
0
Altmetric
Articles

Assessments of citizenship criteria: are immigrants more liberal?

ORCID Icon, , , , ORCID Icon, , & show all
Pages 2625-2646 | Received 13 Dec 2019, Accepted 10 Mar 2020, Published online: 29 Apr 2020

Figures & data

Table 1. Six questions on perceptions of ideal citizenship criteria.

Figure 1. Perceptions of ideal citizenship criteria distributed on each citizenship criterion by macro group.

Figure 1. Perceptions of ideal citizenship criteria distributed on each citizenship criterion by macro group.

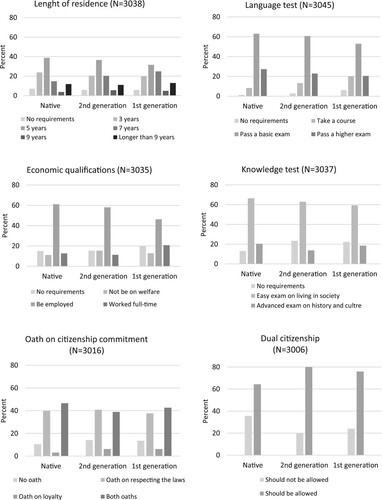
Table 2. Estimating perceptions of ideal citizenship criteria.

Figure 2 Predicted mean levels of perceptions of ideal citizenship criteria by macro group (0 = very liberal and 1 = very restrictive). Note: The figure is based on model 2 in .

Figure 2 Predicted mean levels of perceptions of ideal citizenship criteria by macro group (0 = very liberal and 1 = very restrictive). Note: The figure is based on model 2 in Table 2.

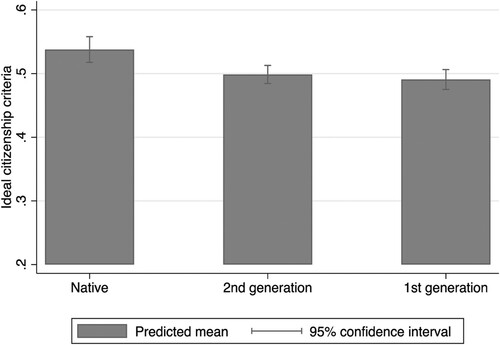
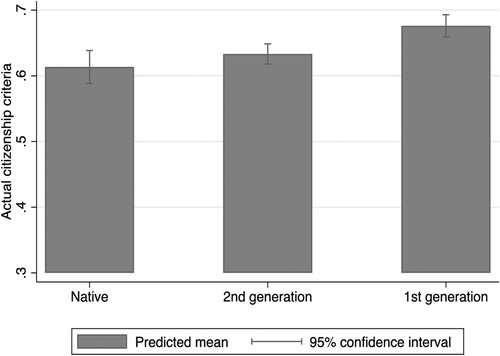
Table 3. Estimating assessment of actual Norwegian citizenship criteria.

Figure 3 Predicted mean levels of perceptions of the actual Norwegian citizenship criteria by macro group (0 = very negative and 1 = very positive). Note: The figure is based on model 2 in .

Figure 3 Predicted mean levels of perceptions of the actual Norwegian citizenship criteria by macro group (0 = very negative and 1 = very positive). Note: The figure is based on model 2 in Table 3.

Table A1. The gross sample, net sample and difference between the gross and net sample, percent (point).

Table A2. Estimating perceptions of ideal citizenship criteria among subgroups (Y = 6 items).

Table A3. Estimating assessments actual citizenship criteria among subgroups (Y = 3 items).