Figures & data
Table 1. Descriptive statistics of the continuous variables of interest.
Table 2. Descriptive statistics of the categorical variables of interest, 2017.
Figure 1. The distribution of income in ENADIS 2017.
Note: N = 15,188; unweighted data.
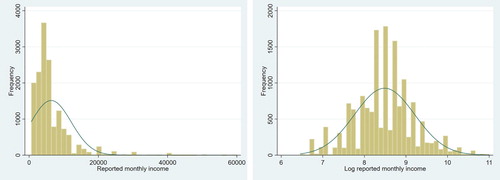
Figure 2. Measuring skin tone in ENADIS 2017 and its distribution.
Note: N = 15,188; unweighted data.
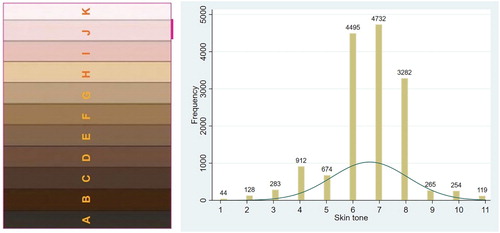
Figure 3. The relationship between reported monthly income, skin tone, and the relevant mediating variables.
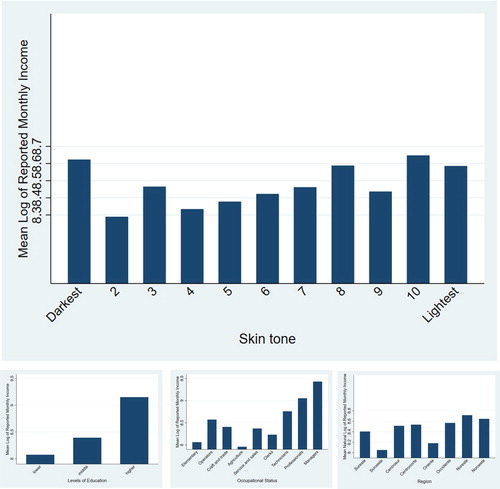
Table 3. Log of reported monthly income regressed on skin tone and relevant variables.
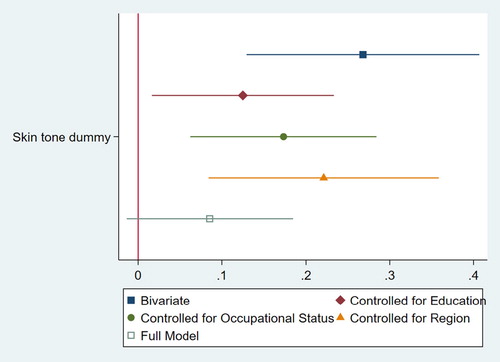
Figure 4. The impact of education, occupational status and region on the regression coefficient of skin tone on reported monthly income.
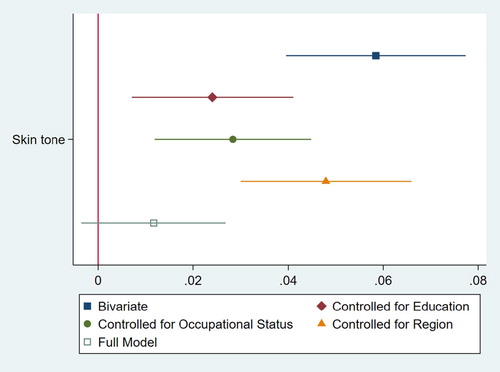
Figure 5. The impact of education, occupational status and region on the regression coefficient of skin tone dichotomized on reported monthly income, reduced dataset.