
Figures & data
Table 1. Local mentor characteristics.
Figure 1. Flow diagram of intervention implementation.
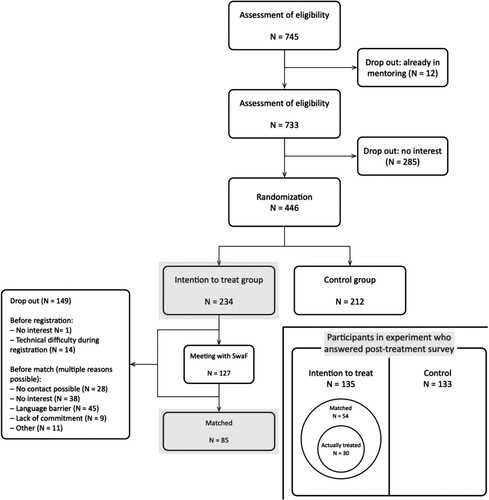
Table 2. Duration of treatment in days.
Table 3. Classification of outcome indicators.
Figure 2. Pre-treatment balancing (univariate), unweighted. Data: IAB-BAMF-SOEP Survey of Refugees (2020). Notes: The squares show the differences in means between the treatment and control groups (treatment – control). The bars represent the 95% confidence intervals. ITT = Intention-to-Treat. In panel (A), the sample also includes respondents who do not participate in the follow-up survey in 2018, at the time of the evaluation of the tandems, due to panel attrition. Table 4 and Tables S3–S5 in the Appendix present the information in tabular form.
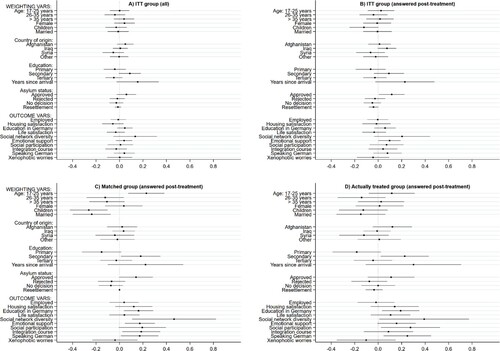
Table 4. Descriptive statistics at baseline.
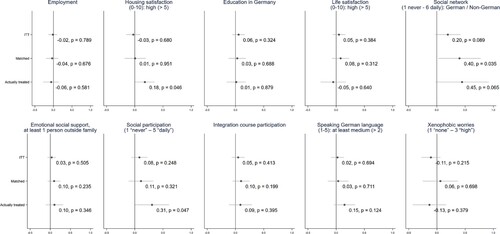
Figure 3. Treatment effects across integration indicators. Data: IAB-BAMF-SOEP Survey of Refugees (2020). Notes: The bars in each box represent the 95% confidence intervals of weighted univariate regressions using our preferred weights. All treatment effects are stated relative to the control group.
Supplemental Material
Download MS Word (1.2 MB)Data availability statement
All data on refugee participants, including the outcome measures, are based on secondary analyses of completely anonymised survey data that is publically available (as part of version 36 of the Socio-Economic Panel (SOEP Citation2021). These data can only be accessed for research purposes and after contractual agreement with the Research Data Centers of the DIW-Berlin or the IAB. All data is delivered with detailed documentation as part of the comprehensive and well-established documentation of the general SOEP Survey. Further information on accessing SOEP-data can be obtained here: https://www.diw.de/en/diw_02.c.222829.en/access_and_ordering.html.