Figures & data
Figure 1. Integration Matrix (Crul and Lelie Citation2019): potential types of responses of people without a migration background to being a minority in majority-minority contexts.
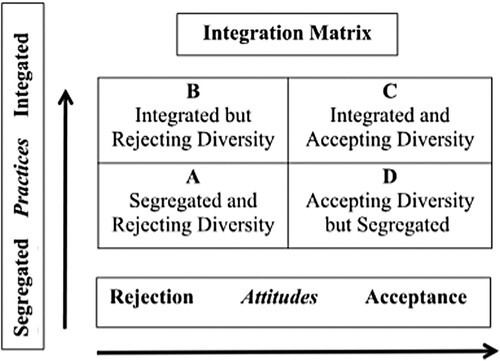
Table 1. Five-cluster solution cluster analysis, cluster centres and distribution (n = 2267).
Figure 2. Summary of regression results: main determinants of cluster membership.
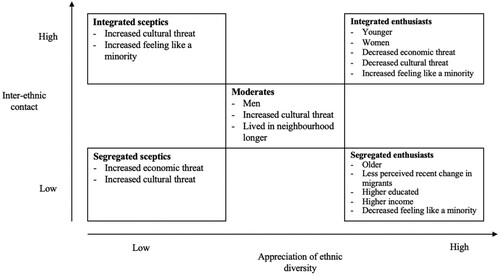
Table 2. Determinants of cluster membership: five multi-level logistic regression models (n = 1458, five cities, 164 neighbourhoods).
Table A1. Number of neighbourhoods per city.
Table A2. Distribution variable integrate/segregation.
Table A3. Distribution variable appreciation/rejection of ethnic diversity.
Table A4. Variable net household income with initial answer categories per country in parentheses.
Table A5. Items for the economic threat scale (Cronbach’s Alpha = .894).
Table A6. Items for the cultural threat scale (Cronbach’s Alpha = .840).
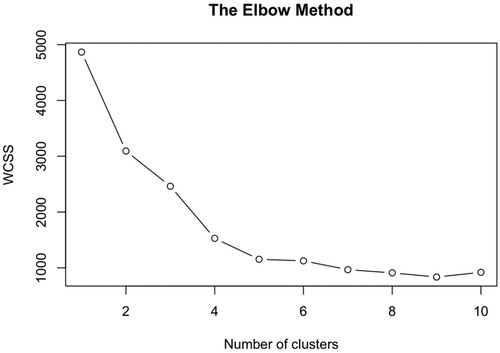
Figure A1. Elbow Method to determine numbers of clusters within cluster sum of squares (WCSS).