10,848
Views
7
CrossRef citations to date
0
Altmetric
Articles

The Asian American assimilation paradox

ORCID Icon & ORCID Icon

Figures & data

Figure 1. Percent of Americans who say they are familiar with the following policies or events related to Asian Americans. Source: 2022 STAATUS Index.
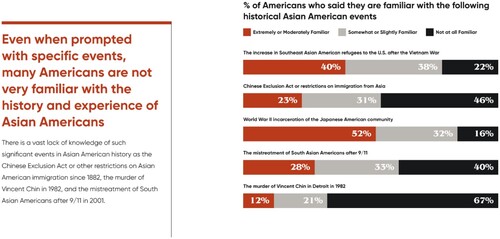
Figure 1. Percent of Americans who say they are familiar with the following policies or events related to Asian Americans. Source: 2022 STAATUS Index.

Figure 2. Percent of First– and Second-Generation Asians and their Nonmigrant Counterparts to Graduate from College. Source: Van C. Tran, Jennifer Lee, and Tiffany J. Huang. ‘Revisiting the Asian Second-Generation Advantage.’ Ethnic and Racial Studies 42 (13) (2019): 2248–2269.
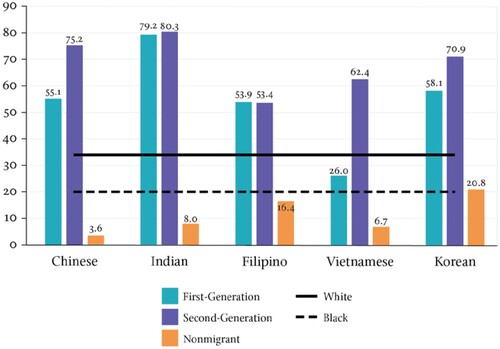
Figure 2. Percent of First– and Second-Generation Asians and their Nonmigrant Counterparts to Graduate from College. Source: Van C. Tran, Jennifer Lee, and Tiffany J. Huang. ‘Revisiting the Asian Second-Generation Advantage.’ Ethnic and Racial Studies 42 (13) (2019): 2248–2269.

Table 1. Everyday Acts of Discrimination Experienced by Asian Americans by Gender

Figure 3. Percent of Americans who say the status of Asian Americans in the U.S. is more similar to people of colour or to White Americans. Source: 2022 STAATUS Index.
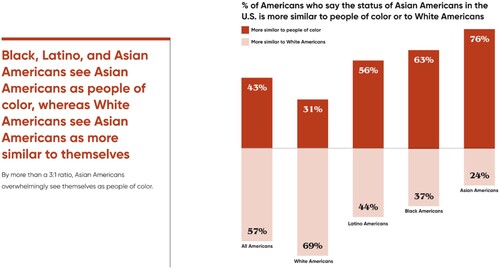
Figure 3. Percent of Americans who say the status of Asian Americans in the U.S. is more similar to people of colour or to White Americans. Source: 2022 STAATUS Index.

Figure 4. Percent of Americans who have been asked, Where are you from, assuming you’re not from the U.S. Source: 2021 American Experience with Discrimination Survey.
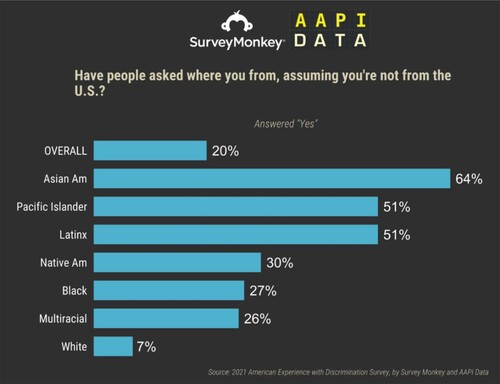
Figure 4. Percent of Americans who have been asked, Where are you from, assuming you’re not from the U.S. Source: 2021 American Experience with Discrimination Survey.