
Figures & data
Figure 1. Theoretical framework.
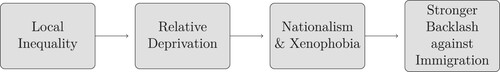
Table 1. Effect of local inequality on perceived relative deprivation.
Figure 2. Local inequality across German municipalities.
The Figure shows the spatial distribution of inequality across German municipalities. The binary measure is based on a within-county median split of the quantitative Gini measure. Missing data is shaded in light gray – this mainly applies to city counties or states that do not contain any constitutive municipalities (e.g. Berlin, Hamburg, and Bremen). Because within-county comparisons are not possible, such units are excluded from my main empirical analysis. Additional details on the calculation of within-municipality inequality based on tax registry data are provided in Sections 3.1 and A.2 in the SI.
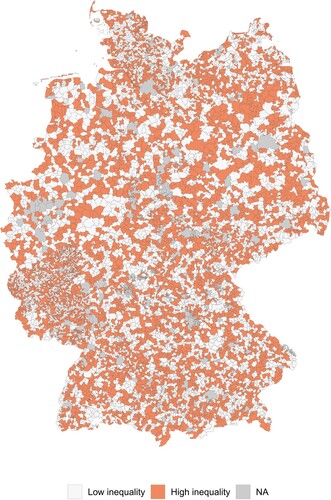
Figure 3. Hate crimes in high- and low-inequality localities over time.
The Figure shows the mean rate of hate crimes in low- and high-inequality municipalities in the matched data set (see Section 3.3 for more details).
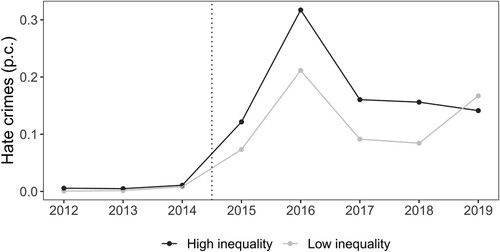
Figure 4. Effect of inequality on xenophobic hate crimes.
The Figure shows effect estimates from difference-in-differences specifications (Imai, Song Kim, and Wang Citation2021). Error bars indicate 95% confidence intervals.
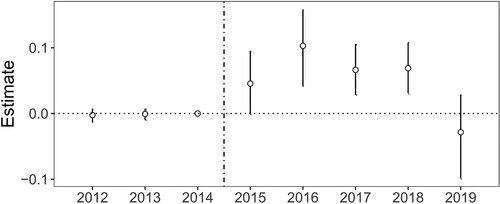
Table 2. Effect of local inequality on German nationalism.