
Figures & data
Table 1. Occupational categories chosen for the vignettes.
Figure 1. OMT differences between groups.
Data: NaDiRa kick-off study.
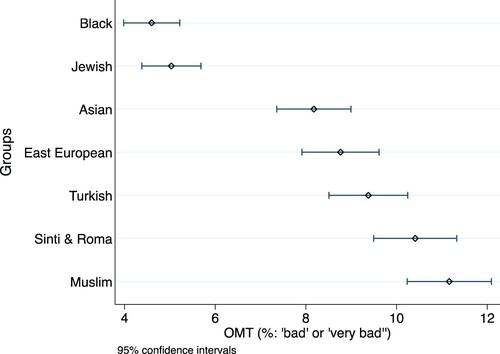
Figure 2. OMT differences between occupations.
Data: NaDiRa kick-off study.
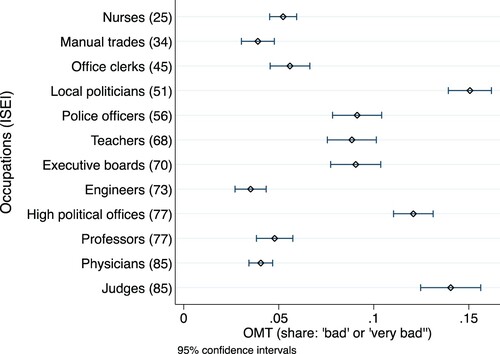
Figure 3. OMT differences between occupations ranked by perceived shortage.
Data: NaDiRa kick-off study.
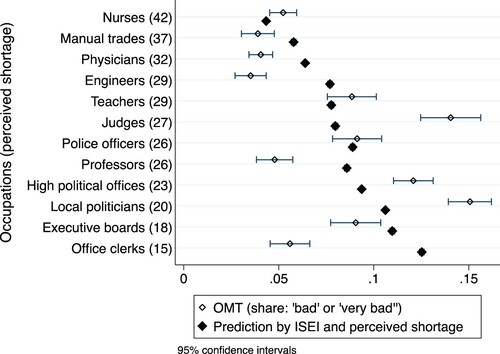
Figure 4. OMT relating to Muslims and Turkish people compared to OMT relating to the other groups and to model predictions.
Data: NaDiRa kick-off study.
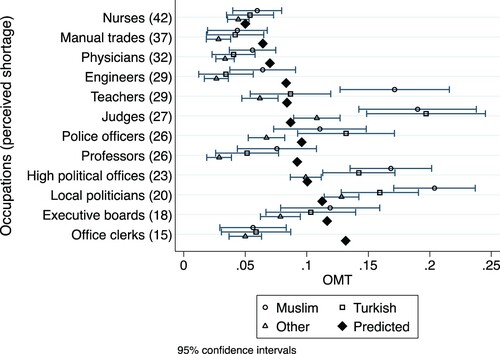
Table A1. Linear probability models of OMT on vignette factors and occupational characteristics.
Data availability statement
The data of this study will be made available for scientific use via the DeZIM Research Data Center (https://fdz.dezim-institut.de/en). Estimated date of publication is the end of 2023.