
Figures & data
Table 1. Distribution of immigrant backgrounds in each host country.
Figure 1. Share who report that they prefer traditional gender roles on at least one out of four items, according to immigration status, country of residence, and level of gender inequality in parental country of origin.
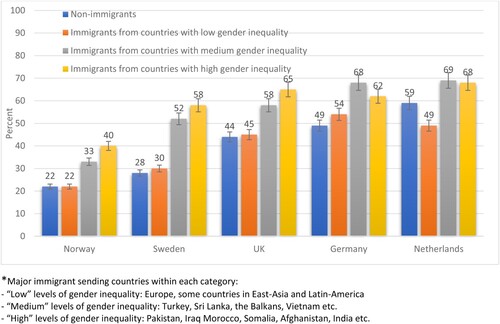
Table 2. Variables used in regression. Immigrant origin respondents only.
Table 3. Stepwise logistic regression. Preference for traditional gender roles as dependent variable.