Figures & data
Figure 1. Health state transition model. Health states are depicted by ellipses, while arrows represent permissible transitions between health states (hashed arrows depict the possibility of achieving SVR and dotted arrows depict a potential reinfection). Note: Model also includes HCC and liver transplant health states for first and subsequent years in those conditions.
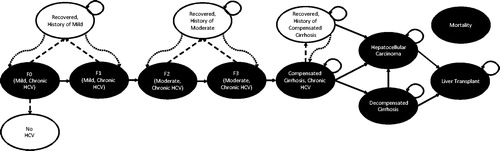
Table 1. Transition-state probabilities, costs, and health-utilities.
Table 2. Baseline patient characteristics.
Table 3. Sustained virologic response, adverse events, drug costs, and regimen-related disutilities.Table Footnotea
Table 4. Lifetime liver outcome rates by treatment.
Figure 2. Scatter plot of total cost and QALYs for DAA regimens in GT1 cohort. For each treatment the point shown represents the total cost and QALYs produced.
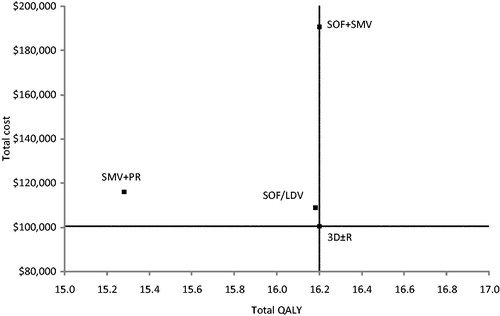
Table 5. Total costs, life-years, QALYs, and cost-effectiveness of treatments.
Figure 3. Cost-effectiveness acceptability curves for GT1 analysis. Curves shown represent results from Monte Carlo simulations in probabilistic sensitivity analysis of treatment options compared in the GT1 population. Each line (representing a different treatment option) shows the percentage of simulations that option was the most cost-effective at each willingness-to-pay threshold. Note that only options that were estimated to be most cost-effective in at least one simulation appear in figure.
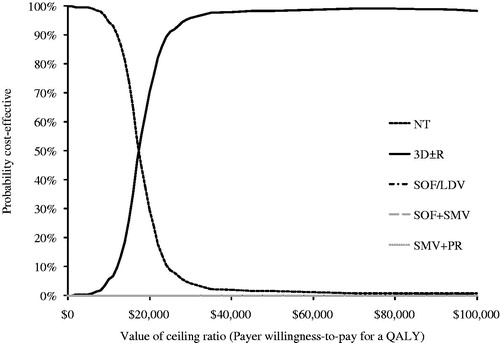
Figure 4. Cost-effectiveness acceptability curves for non-cirrhotic GT4 analysis. Curves shown represent results from Monte Carlo simulations in probabilistic sensitivity analysis of treatment options compared in the GT4 population. Each line (representing a different treatment option) shows the percentage of simulations that option was the most cost-effective at each willingness-to-pay threshold. Note that only options that were estimated to be most cost-effective in at least one simulation appear in figure.
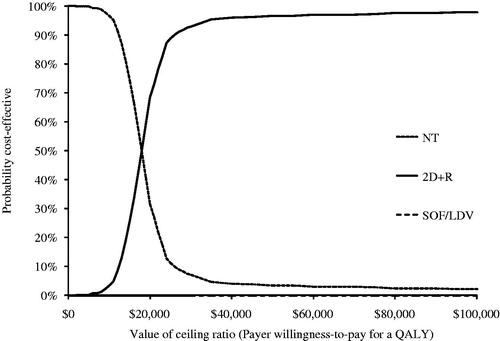
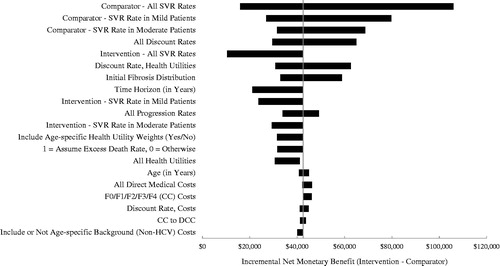
Figure 5. Tornado diagram comparing 3D ± R (Intervention) to SOF/LDV (Comparator) in GT1 patients. The diagram shows the impact of individually varying parameters in the base case expressed in incremental net monetary benefit (INMB) assuming a payer willingness-to-pay of $100,000. Positive INMB values indicate that 3D ± R is cost-effective and negative INMB values indicate that SOF/LDV is cost-effective. The diagram shows the impact of the 20 most influential parameters. The tornado diagram is centered on the base case INMB value for the comparison of 3D ± R to SOF/LDV in GT1 patients, which is $10,435.
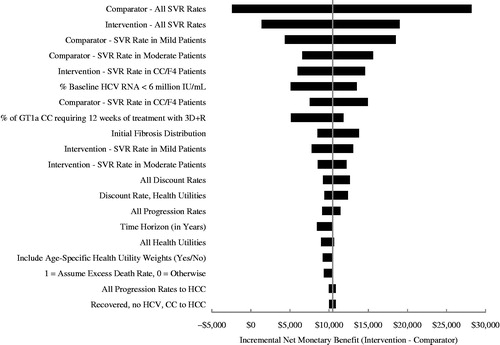
Figure 6. Tornado diagram comparing 2D + R (Intervention) to SOF/LDV (Comparator) in non-cirrhotic GT4 patients. The diagram shows the impact of individually varying parameters in the base case expressed in incremental net monetary benefit (INMB), assuming a payer willingness-to-pay of $100,000. Positive INMB values indicate that 2D + R is cost-effective and negative INMB values indicate that SOF/LDV is cost-effective. The diagram shows the impact of the 20 most influential parameters. The tornado diagram is centered on the base case INMB value for the comparison of 2D + R to SOF/LDV in non-cirrhotic GT4 patients, which is $42,475.